
NWEA Map Scores in 2025 and 2026 – Map Growth Norms – What is New in 2026?
The 2026 MAP Growth Norms: What Parents Need to Know.
NWEA MAP Growth Norms have been updated for 2026. This is what it means.
As parents, we want to know how our children are doing in school. Not just in isolation, but compared to other kids their age across the country. That’s where MAP Growth norms come in.
NOTE: See the Updated NWEA Map Scores chart by Grade Level for 2025-2026 (with percentiles) here.
In August 2025, NWEA updated the norms. These are the benchmarks used to interpret your child’s MAP Growth RIT scores. Your child’s test hasn’t changed. And the RIT scale is the same one you already know. What is new is the “reference point” for interpreting those scores.
Think of it like Google Street View updating photos: the streets are the same, but now you’re seeing a current view of the neighborhood, not an old snapshot.
Why Did NWEA Update the Norms?
Norms are like a national snapshot of student performance. But kids, schools, and teaching practices change over time. To make sure the data stays accurate and useful, NWEA refreshes its norms every few years.
The 2025 update is especially important because it also reflects changes in how the test chooses questions, thanks to a new system called the Enhanced Item Selection Algorithm (EISA). This makes the test more closely aligned to your child’s grade level and ability. The new norms also ensure that percentiles reflect today’s students, not those from five years ago.
What’s Changed in 2025
Here are the main things parents should know about the new norms:
- Scores haven’t changed: Your child’s RIT score is still the same. What has shifted is how that score compares nationally.
- Percentiles are different: In general, a child’s score now corresponds to a higher percentile rank than it did under the 2020 norms. For example, a fifth-grade reading score that used to be at the 50th percentile might now be at the 56th percentile.
- Subject patterns vary:
- Reading and language usage: Lower-achieving students are showing the biggest shifts downward.
- Math: Patterns are more complex, but many students—especially in early grades—are showing higher growth because of the new test algorithm.
- Science: More stable, with fewer shifts overall.
What This Means for Your Child
- Percentiles look differentIf you’re used to seeing your child’s score in one percentile, don’t be surprised if it’s now higher with the new norms. Their actual performance hasn’t changed—the comparison group has.
- Program eligibility may shift
- More students may now qualify for gifted or advanced learning programs.
- Fewer students may qualify for intervention programs, since the thresholds based on percentiles have moved.
- Consistency matters
Bottom line: how to read your child’s scores
In most cases, the same RIT score will now map to a higher percentile than it did under the 2020 norms. That doesn’t mean your child suddenly performed differently; it means the national comparison has been updated to reflect today’s students. Patterns still vary by subject, grade, and achievement level, so expect some exceptions.
Variation by subject and performance level
It isn’t simply “up” or “down” across the board. The biggest shifts tend to appear for lower-achieving students, especially in reading and language usage, where lower RIT scores now align with the same percentile ranks. Math shows a more mixed picture, particularly for higher achievers and for growth. Science remains the most stable of the subjects.
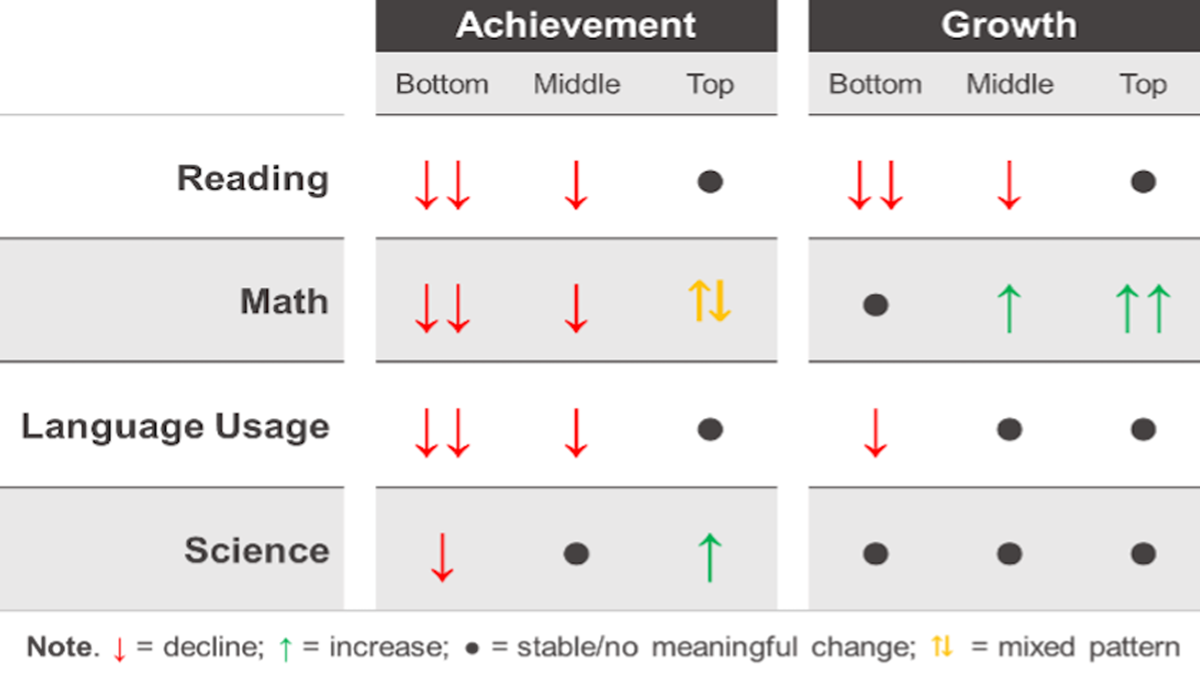
NWEA map scores growth norms 2025-2026 – Example. How to use the image above
- Reading and language usage: Expect larger declines at the lower end; a lower RIT can still correspond to the same percentile.
- Math: More complex pattern; some grades and higher-achieving students show stronger typical growth.
- Science: Relatively steady with smaller shifts overall.
What this means for families
- A higher percentile with the same RIT score usually reflects the updated national comparison, not a sudden jump in performance.
- Look at growth over time and classroom progress, not just a single percentile.
- If your school uses percentiles for placement, thresholds may be reviewed to match the new norms.
When you compare reports from 2020 norms to those with 2025 norms, remember that changes in percentile don’t necessarily mean your child has suddenly improved or declined. It may simply reflect the updated national sample.
Why Parents Can Trust MAP Growth Norms
Even with these updates, the strengths of MAP Growth remain the same:
- Large sample size: Based on 116 million scores from nearly 14 million students across all 50 states.
- Rigorous methods: Peer-reviewed research ensures the data is reliable and fair.
- Precision in timing: Norms consider the exact week of instruction, making comparisons more accurate than simple “fall” or “spring” labels.
- Student + school comparisons: You can see how your child compares to peers nationwide, and schools can see how they stack up too.
Key Takeaways for Parents
- Your child’s RIT score hasn’t changed. What’s changed is how that score compares nationally.
- Percentiles are shifting upward. Many students will appear at a higher percentile now than they did before.
- Program cutoffs may change. If your district uses percentiles for gifted or intervention programs, the new norms could affect who qualifies.
- The new norms are more accurate. They reflect today’s students and the realities of post-COVID learning.
Common Parent Questions
Q: Why did NWEA update the norms now? A: To keep them current with today’s students, account for the impact of COVID on learning, and align with the improved test algorithm.
Q: Will my child’s reports look different? A: Yes. Starting July 2025, all reports will use the new norms, so percentile ranks may shift.
Q: Does this mean my child is doing better or worse? A: Not necessarily. Their RIT score hasn’t changed. The shift reflects how the national student population is performing today.
Q: Should I be worried if my child’s percentile changes? A: No. Percentiles are just one way to look at performance. Focus on growth over time and how your child is progressing toward their personal goals.
Bottom Line for Parents
The 2025 MAP Growth norms are like updating the measuring stick to reflect today’s reality. They give you and your child’s teachers a more accurate picture of where your child stands compared to peers nationwide.
Your child’s learning journey hasn’t changed—but now, you’ll be seeing it through a sharper, more up-to-date lens.
See the Updated NWEA Map Scores chart by Grade Level for 2025-2026 (with percentiles) here.