
What is a Good iReady Diagnostic Score for 8th Grade? (and 1-7th Grade) Math + Reading
What is a Good iReady Diagnostic Score for 8th Grade (1-10th Grade)? What is a Good i-Ready Diagnostic Score for 7th Grade Math and Reading? Get the answers here.
What is a Good iReady Diagnostic Score?
A good iReady Diagnostic score for 2nd Grade Math ranges from 399 to 451 based on the 50th to 98th percentile of scores. See the full list of ‘Good’ and ‘Average’ i-Ready Diagnostic Scores by Grade Level, below.
iReady is a widely used adaptive assessment tool that helps educators understand students’ strengths and weaknesses in reading and math. The iReady Diagnostic Score is a measure of a student’s academic performance and readiness for their grade level. But what exactly is considered a “good” iReady Diagnostic Score?
A “good” score typically means that a student is performing at or above their grade level. iReady categorizes scores into different performance levels:
- Below Grade Level
- Early On Grade Level
- On Grade Level
- Above Grade Level.
The goal for most students is to be On Grade Level or Above by the end of the academic year.
Let’s explore what a good iReady Diagnostic Score looks like for each grade level. These ‘good’ i-Ready Diagnostic scores are based on the 50th to the 98th percentile of iReady scores for Math and Reading for 2024-2025, for the FALL placement. Students are expected to increase these scores as the schoolyear progresses, There are three iReady placement assessment tests throughout the year Fall, Winter and Spring.
What is a Good iReady Diagnostic Score for Kindergarten Math?
A good iReady Diagnostic score for Kindergarten Math ranges from 339 to 390 based on the 50th to 98th percentile.
What is a Good iReady Diagnostic Score for Kindergarten Reading?
A good iReady Diagnostic score for Kindergarten Reading ranges from 341 to 423 based on the 50th to 98th percentile.
What is a Good iReady Diagnostic Score for 1st Grade Math?
A good iReady Diagnostic score for 1st Grade Math ranges from 372 to 428 based on the 50th to 98th percentile.
What is a Good iReady Diagnostic Score for 1st Grade Reading?
A good iReady Diagnostic score for 1st Grade Reading ranges from 399 to 504 based on the 50th to 98th percentile.
What is a Good iReady Diagnostic Score for 2nd Grade Math?
A good iReady Diagnostic score for 2nd Grade Math ranges from 399 to 451 based on the 50th to 98th percentile.
What is a Good iReady Diagnostic Score for 2nd Grade Reading?
A good iReady Diagnostic score for 2nd Grade Reading ranges from 453 to 560 based on the 50th to 98th percentile.
What is a Good iReady Diagnostic Score for 3rd Grade Math?
A good iReady Diagnostic score for 3rd Grade Math ranges from 424 to 474 based on the 50th to 98th percentile.
What is a Good iReady Diagnostic Score for 3rd Grade Reading?
A good iReady Diagnostic score for 3rd Grade Reading ranges from 496 to 598 based on the 50th to 98th percentile.
What is a Good iReady Diagnostic Score for 4th Grade Math?
A good iReady Diagnostic score for 4th Grade Math ranges from 445 to 502 based on the 50th to 98th percentile.
What is a Good iReady Diagnostic Score for 4th Grade Reading?
A good iReady Diagnostic score for 4th Grade Reading ranges from 531 to 631 based on the 50th to 98th percentile.
What is a Good iReady Diagnostic Score for 5th Grade Math?
A good iReady Diagnostic score for 5th Grade Math ranges from 463 to 522 based on the 50th to 98th percentile.
What is a Good iReady Diagnostic Score for 5th Grade Reading?
A good iReady Diagnostic score for 5th Grade Reading ranges from 557 to 650 based on the 50th to 98th percentile.
What is a Good iReady Diagnostic Score for 6th Grade Math?
A good iReady Diagnostic score for 6th Grade Math ranges from 475 to 542 based on the 50th to 98th percentile.
What is a Good iReady Diagnostic Score for 6th Grade Reading?
A good iReady Diagnostic score for 6th Grade Reading ranges from 576 to 667 based on the 50th to 98th percentile.
What is a Good iReady Diagnostic Score for 7th Grade Math?
A good iReady Diagnostic score for 7th Grade Math ranges from 487 to 557 based on the 50th to 98th percentile.
What is a Good iReady Diagnostic Score for 7th Grade Reading?
A good iReady Diagnostic score for 7th Grade Reading ranges from 593 to 681 based on the 50th to 98th percentile.
What is a Good iReady Diagnostic Score for 8th Grade Math?
A good iReady Diagnostic score for 8th Grade Math ranges from 495 to 572 based on the 50th to 98th percentile.
What is a Good iReady Diagnostic Score for 8th Grade Reading?
A good iReady Diagnostic score for 8th Grade Reading ranges from 606 to 692 based on the 50th to 98th percentile.
What is a Good iReady Diagnostic Score for 9th Grade Math?
In 9th grade, Math scores typically range from 100 to 800. A good score is approximately 496–574, showing proficiency in algebra and trigonometry.
What is a Good iReady Diagnostic Score for 9th Grade Reading?
For 9th grade Reading, scores generally range from 100 to 800. A good score is 612–705, reflecting strong reading comprehension.
What is a Good iReady Diagnostic Score for 10th Grade Math?
For 10th graders, Math scores usually fall between 100 and 800. A good score in 10th grade Math is around 503–585, indicating readiness for calculus.
What is a Good iReady Diagnostic Score for 10th Grade Reading?
For 10th grade Reading, scores range from 100-800. A good score is 624–718, reflecting strong literary and analytical skills.
What is a Good i-Ready Diagnostic Score? (Chart).
Have a look at this chart to get a better understanding of what is a ‘good’ iReady Diagnostic score in 2025, by grade level. These scores are the FALL placement levels at the 50th percentile placement, and more. There are three placement assessments throughout the year, Fall, Winter and Spring, and students score higher throughout the year.
| Grade | Math Score Range | Good Math Score | Reading Score Range | Good Reading Score |
|---|---|---|---|---|
| Kindergarten | 100 – 800 | 358+ | 100 – 800 | 349+ |
| 1st Grade | 100 – 800 | 390+ | 100 – 800 | 399+ |
| 2nd Grade | 100 – 800 | 414+ | 100 – 800 | 453+ |
| 3rd Grade | 100 – 800 | 439+ | 100 – 800 | 496+ |
| 4th Grade | 100 – 800 | 457+ | 100 – 800 | 531+ |
| 5th Grade | 100 – 800 | 472+ | 100 – 800 | 557+ |
| 6th Grade | 100 – 800 | 484+ | 100 – 800 | 576+ |
| 7th Grade | 100 – 800 | 495+ | 100 – 800 | 593+ |
| 8th Grade | 100 – 800 | 501+ | 100 – 800 | 606+ |
| 9th Grade | 100 – 800 | 496–574 | 100 – 800 | 612–705 |
| 10th Grade | 100 – 800 | 503–585 | 100 – 800 | 624–718 |
Understanding i-Ready Placement Reports: A Guide for Parents.
When reviewing your child’s i-Ready Diagnostic reports, you may see two types of placements: Absolute Placements and Relative Placements. These help you understand your child’s learning progress in Reading and Math.
What Do These Placements Mean?
- Absolute Placement
- Represents the grade level that matches your child’s current performance.
- Example: If a third-grade student performs at a first-grade level, their absolute placement would be Grade 1.
- Used to assess how close a child is to meeting grade-level expectations based on college- and career-readiness standards.
- Relative Placement
- Compares your child’s performance to their actual grade level.
- Example: A third-grade student performing at a first-grade level would have a relative placement of Two Grade Levels Below.
- Used to identify students who may need extra support or intervention, providing a broader picture of their academic growth.
Understanding the Different i-Ready Placement Levels.
Absolute Placement Levels
- Early On Grade Level (e.g., Early 3 for a third-grade student)
- Students have partially met grade-level expectations and benefit from on-grade instruction.
- Mid Grade Level (e.g., Mid 3 for a third-grade student)
- Students meet the minimum requirements for their grade level and benefit from instruction in later on-grade topics.
- Late Grade Level (e.g., Late 3 for a third-grade student)
- Students have successfully met or surpassed grade-level expectations and may be ready for early instruction in the next grade level.
- Below Grade Level (e.g., Grade 2, Grade 1, or Kindergarten for a third-grade student)
- Students need remediation focused on below-grade material to address learning gaps.
- Above Grade Level (e.g., Grade 4 for a third-grade student)
- Students benefit from above-grade instruction, having met or surpassed grade-level expectations.
Relative Placement Levels.
- Early On Grade Level
- Students have partially met grade-level expectations and benefit from continued grade-level instruction.
- One Grade Level Below
- Students are approaching grade-level expectations and benefit from both grade-level instruction and targeted support.
- Two Grade Levels Below
- Students need extra support with foundational skills to prepare for grade-level instruction and may require formal intervention.
- Three or More Grade Levels Below
- Students require significant support in foundational skills and formal intervention to help them catch up to their grade level.
- Mid, Late, or Above Grade Level
- Students at this level have met or exceeded grade-level standards and benefit from advanced instruction or enrichment activities.
How These Placements Are Used
- Schools use these placements to track progress, determine interventions, and measure academic growth.
- 3-Level Placements (green, yellow, red) are often used for intervention screenings, adjusting across the school year.
- 5-Level Placements (ranging from Above Grade Level to Three or More Grade Levels Below) provide consistent measurement across the year.
- Some students may receive a Max Score, indicating that they have exceeded the tested grade levels and do not require further instruction in that domain.
What Can Parents Do?
- Stay Informed – Review your child’s placement levels and discuss progress with their teacher.
- Support at Home – Encourage reading, math practice, and interactive learning activities.
- Communicate with Educators – If your child is placed below grade level, ask how you can help at home and what interventions the school is providing.
Basically i-Ready Diagnostic used 5 different Grade placement levels. The goal for most students is to be On Grade Level or Above by the end of the academic year.
i-Ready Diagnostic Scores Overall Math Placement Levels – 2024-2025.
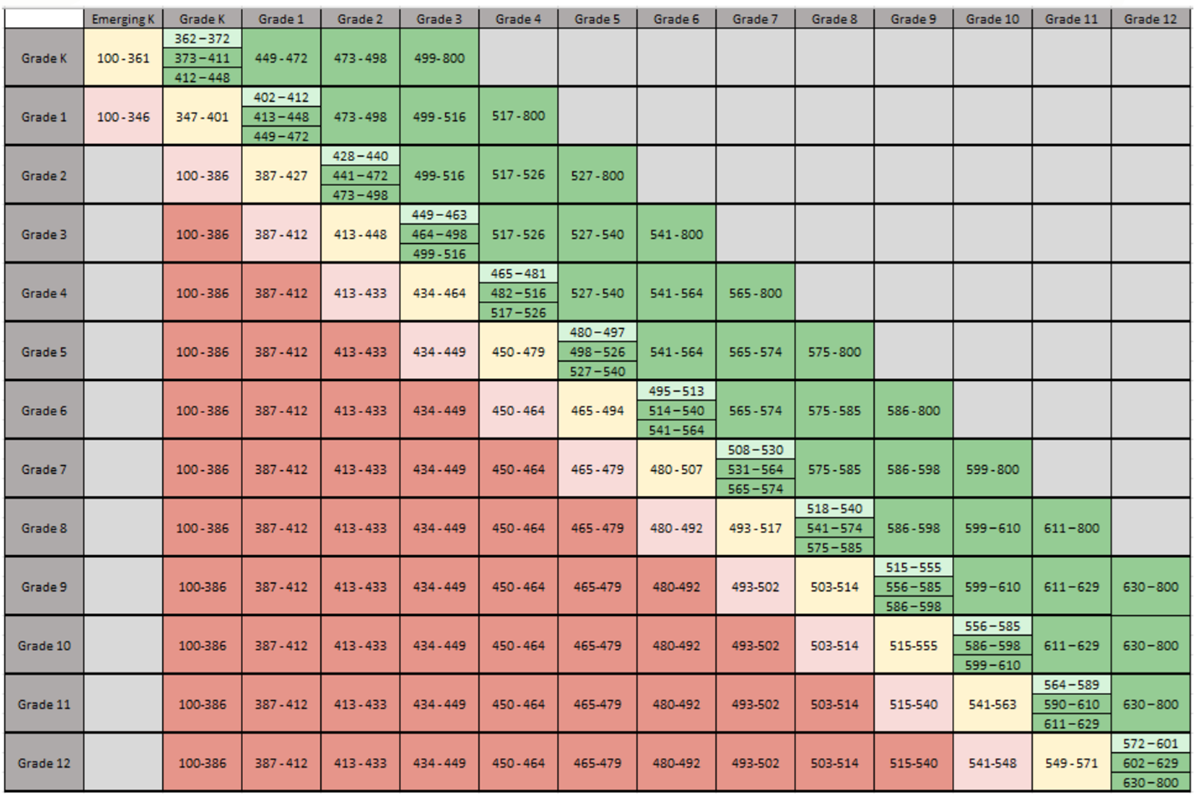
How to Read Your Child’s i-Ready Placement Score on the Chart Above
Understanding your child’s i-Ready Diagnostic score can help you track their progress and identify areas where they may need support. Here’s how to read the placement table for Math, above:
1. Find Your Child’s Grade Level
Look at the first column of the placement table and locate your child’s current grade level. This row will show where their score falls in relation to their grade.
2. Locate Your Child’s Score Range
Find the range that includes your child’s score. The column label for that range tells you their grade-level placement.
3. Understand the Placement Levels
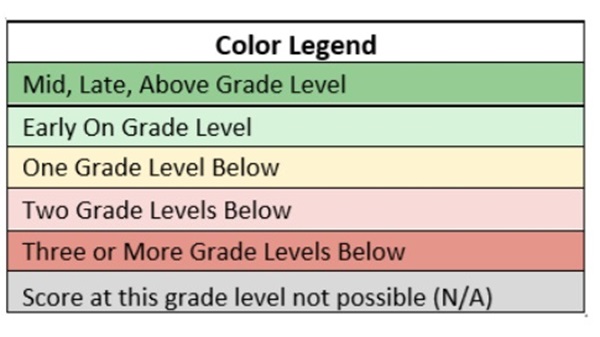
Each score falls into a color-coded category:
- Green (On Grade Level)
- Early On Grade Level (light green)
- Mid Grade Level (darker green)
- Late Grade Level (darker green)
- Yellow (One Grade Level Below) – Some additional support is needed.
- Orange (Two Grade Levels Below) – Significant support is needed.
- Red (Three or More Grade Levels Below) – Intensive support is needed.
- Gray – This score is not possible for the selected grade.
Use these color codes for the iReady diagnostic grade level chart, above.
Example: How to Interpret a Score
- Student A is in 3rd grade and received a score of 500 in Reading.
- Looking at the 3rd-grade row, a score of 500 falls in the 474-510 range, which is a 2nd-grade placement.
- Since this range is shaded yellow, Student A is considered one grade level below in Reading.
Why This Matters
Your child’s i-Ready placement score helps teachers personalize their learning. If your child is below grade level, schools will provide extra support to help them catch up. If they are on or above grade level, teachers will continue to challenge them to grow.
i-Ready Diagnostic Scores – Math Placement Levels By Score Range – 2024-2025.
We have simplified the chart above a little, so you can quickly see how the i-Ready Diagnostic system places your child’s scores according to grade level. For example, if your child is 4rth Grade and scores
| Grade Level | Three or More Grade Levels Below | Two Grade Levels Below | One Grade Level Below | Early On Grade Level | Mid, Late, Above Grade Level |
|---|---|---|---|---|---|
| K | 100-361 | 362-372 | 373-800 | ||
| 1 | 100-346 | 347-401 | 402-412 | 413-800 | |
| 2 | 100-386 | 387-427 | 428-440 | 441-800 | |
| 3 | 100-386 | 387-412 | 413-448 | 449-463 | 464-800 |
| 4 | 100-412 | 413-433 | 434-464 | 465-481 | 482-800 |
| 5 | 100-433 | 434-449 | 450-479 | 480-497 | 498-800 |
| 6 | 100-449 | 450-464 | 465-494 | 495-513 | 514-800 |
| 7 | 100-464 | 465-480 | 481-507 | 508-530 | 531-800 |
| 8 | 100-479 | 480-492 | 493-517 | 518-540 | 541-800 |
| 9 | 100-492 | 493-502 | 503-514 | 515-555 | 556-800 |
| 10 | 100-502 | 503-514 | 515-540 | 541-563 | 564-800 |
| 11 | 100-514 | 515-540 | 541-563 | 564-589 | 590-800 |
| 12 | 100-540 | 541-548 | 549-571 | 572-602 | 603-800 |
How to Increase Your iReady Diagnostic Score.
If you or your child wants to improve their iReady Diagnostic Score, here are some effective strategies:
- Consistent Practice – Regularly working on iReady lessons can help reinforce skills and improve performance.
- Reading Daily – Reading a variety of books, articles, and essays can enhance vocabulary and comprehension skills.
- Math Drills and Problem-Solving – Practicing math problems daily helps improve fluency and problem-solving abilities.
- Seek Additional Support – Tutoring, educational apps, and teacher assistance can provide targeted help.
- Set Goals and Monitor Progress – Setting realistic goals and tracking improvement can motivate students to perform better.
- Stay Engaged and Motivated – Keeping a positive mindset and staying engaged in learning will contribute to long-term success.