
NWEA Map Test Scores by Grade Level 2024-2025 – NWEA Scores Chart
NWEA MAP Test Scores 2024-2025.
As a parent, you want to know how well your child is progressing in school and what their test scores really mean. The NWEA MAP Test Scores by Grade Level for 2024-2025 provide valuable insights into your child’s academic growth.
But what is a good NWEA MAP score? And how can you use these scores to help support your child’s education? In this guide, we’ll explain what MAP scores are, how they’re measured, and what they mean for your child’s learning journey.
For a visual representation of the NWEA Map Scores 2024-2025, as well as percentiles, please see our NWEA Map scores Grade Level page.
NOTE: A student’s NWEA map test scores should change throughout the course of the school year. See our NWEA Maps Scores 2025 – Fall, Winter, Spring, for norms scores at different times of the school year.
What Are NWEA MAP Scores?
The NWEA MAP (Measures of Academic Progress) Test is a nationally recognized assessment used by schools to measure student achievement and growth. These tests are computer-adaptive, meaning the questions adjust in difficulty based on your child’s responses.
MAP tests cover key subjects like:
- Reading
- Mathematics
- Language Usage
Unlike traditional tests, MAP assessments track progress over time, helping parents and teachers understand how well a student is learning and where they may need extra support.
What Are RIT Scores?
MAP test results are reported as RIT scores (Rasch Unit Scores), a special type of measurement that helps track student progress independently of grade level.
Key things to know about RIT scores:
- They range from 100 to 300, with higher scores indicating higher achievement.
- Unlike letter grades, RIT scores measure growth over time rather than just a final performance.
- Because the RIT scale is equal-interval, a 5-point increase means the same level of improvement whether a student is in 2nd grade or 10th grade.
This means that a third-grader and an eighth-grader with the same RIT score are performing at the same academic level for that specific skill.
NWEA MAP Scores by Grade Level (2024-2025)
The MAP test scores help parents understand:
- How well your child is performing compared to national norms.
- How much your child has improved since their last test.
- What areas may need more support to ensure academic success.
Since the RIT scale applies across all grades and subjects, it provides a consistent and reliable way to track progress year after year.
If you’re curious about where your child’s scores fall and what they mean for their education, reviewing the NWEA MAP Score norms for 2024-2025 can give you a clear picture of their learning growth.
Why MAP Scores Matter for Your Child’s Education
- Personalized Learning: Since the MAP test is adaptive, it pinpoints exactly where your child is excelling or struggling—not just their overall grade level.
- Early Intervention: If your child is behind in a subject, their MAP scores can help identify challenges early, allowing teachers and parents to step in with additional support.
- Goal Setting: By tracking year-over-year growth, MAP scores help set realistic learning goals that motivate students to improve.
- College & Career Readiness: As students move through middle and high school, MAP scores help assess their readiness for more advanced coursework, including high school graduation requirements and college entrance benchmarks.
Final Thoughts: How Parents Can Use MAP Scores
As a parent, you don’t need to be an expert in testing to use MAP scores effectively. Here’s what you can do:
- Ask your child’s teacher about their scores and how they compare to expected growth.
- Encourage learning at home by focusing on subjects where they may need extra help.
- Track progress over time and celebrate growth, no matter how big or small.
Understanding NWEA MAP Test Scores can help you support your child’s educational journey in a meaningful way. Whether they’re excelling or need a little extra help, these scores provide valuable insights into their learning path.
Would you like more details on specific grade-level MAP score expectations? Let me know! 😊
The MAP scores below show the FALL scores.
Naturally, the mean MAP Test scores level improve as the school-year progresses through the Fall, Winter, or Spring MAP Tests. If you are interested in seeing the NWEA MAP Test scores for all time-frames, fall, winter, and spring, then visit our NWEA Map Scores Fall, Winter, and Spring page.
NWEA MAP Test Scores – Kindergarten.
In Kindergarten, the MAP (Measures of Academic Progress) test checks on basic reading, speaking, and math skills. It’s like taking a snapshot of what young kids know about letters, words, and numbers. Teachers use this info to see how well students are picking up early reading and math, like knowing their ABCs, starting to read, and understanding basic math like counting and simple sums.
| Percentile | Math | Language Usage | Reading | |
|---|---|---|---|---|
| Higher Achievement |
90 84 69 |
160 152 146 |
n/a n/a n/a |
157 149 143 |
| Median and Mean | 50 | 140 | n/a | 137 |
| Lower Achievement | 31 16 5 |
133 127 119 |
n/a n/a n/a |
131 124 117 |
- Starting off with reading and math.
- Kids begin to pick up on reading and start working with numbers.
- The test results help teachers figure out where kids might be struggling and how to help them get better.
NWEA MAP Test Scores – 1st Grade.
By the end of first grade, kids are expected to be able to read simple books and understand what they mean. They should also know how to add and subtract numbers up to 20 and have a basic grasp of measurement and shapes. The 1st Grade MAP test goes a bit further than the one in kindergarten, focusing more on reading skills, understanding words better, and using grammar correctly. It also checks how well students are doing with basic math like addition, subtraction, and simple geometry.
| Percentile | Math | Language Usage | Reading | |
|---|---|---|---|---|
| Higher Achievement |
95 84 69 |
181 172 166 |
n/a n/a n/a |
177 169 162 |
| Median and Mean | 50 | 160 | n/a | 156 |
| Lower Achievement | 31 16 5 |
154 148 140 |
n/a n/a n/a |
150 156 135 |
- Understanding what they read and basic math skills.
- Kids continue to improve their reading and math from what they started in kindergarten.
- Teachers use the results from this test to figure out exactly where each student needs the most help and adjust their teaching methods to fit those needs better.
NWEA MAP Testing Scores – 2nd Grade.
In second grade, students are expected to tackle more complex reading materials and discuss what they’ve read. They should also be comfortable adding and subtracting two-digit numbers, telling time, and beginning to understand fractions. The 2nd Grade MAP test pushes these skills further, assessing students on their ability to handle tougher texts, grasp grammar and sentence structure, and solve advanced math problems including early multiplication and division.
| Percentile | Math | Language Usage | Reading | |
|---|---|---|---|---|
| Higher Achievement |
95 84 69 |
196 188 181 |
200 190 182 |
197 187 180 |
| Median and Mean | 50 | 175 | 174 | 172 |
| Lower Achievement | 31 16 5 |
169 162 154 |
166 158 148 |
165 157 147 |
- Improving reading skills and math problem-solving.
- Students work on building a larger vocabulary and reading more smoothly.
- Teachers use the results from this test to spot where students might be struggling and to tailor their teaching to help students improve in specific areas like basic math operations.
NWEA MAP Test Scores – 3rd Grade.
By the end of third grade, kids are expected to read at their grade level smoothly and understand what they’re reading. They should also know how to multiply and divide numbers up to 100 and figure out simple math problems that use words. The 3rd Grade MAP test measures how much they’ve grown in reading, speaking, and math, with a bigger focus now on critical thinking and solving problems. It checks how well they understand difficult texts, their knowledge of more complex grammar and writing rules, and their skills in multiplication, division, fractions, and basic shapes.
| Percentile | Math | Language Usage | Reading | |
|---|---|---|---|---|
| Higher Achievement |
95 84 69 |
211 202 195 |
213 203 195 |
214 203 195 |
| Median and Mean | 50 | 188 | 188 | 187 |
| Lower Achievement | 31 16 5 |
180 172 163 |
180 172 163 |
178 170 159 |
- Reading harder texts and mastering basic math operations like multiplication and division.
- Students work on getting better at understanding challenging reading materials and using math skills in everyday situations.
- Teachers use the test results to fine-tune their lessons to better help students improve in areas where they’re struggling.
NWEA MAP Test Scores – 4th Grade.
In fourth grade, students dive into more complex reading and critical analysis of texts. They’re also expected to handle larger numbers in multiplication and division, and understand fractions and decimals in greater detail. They tackle tougher word problems, too. The 4th Grade MAP test assesses these skills, focusing on students’ abilities to analyze texts and grasp advanced concepts in both language and math.
| Percentile | Math | Language Usage | Reading | |
|---|---|---|---|---|
| Higher Achievement |
95 84 69 |
223 214 207 |
222 212 205 |
224 213 205 |
| Median and Mean | 50 | 200 | 197 | 197 |
| Lower Achievement | 31 16 5 |
192 185 176 |
190 182 172 |
188 180 169 |
- Analyzing detailed texts, and understanding fractions and decimals.
- Students work on interpreting texts deeply and applying complex math concepts like fractions and decimals to various situations.
- Teachers use the results from this test to adjust their teaching strategies, targeting specific areas where students need more help to bridge any learning gaps.
NWEA MAP Test Scores – 5th Grade.
By the end of fifth grade, students are expected to read and critically analyze a wide range of texts, including both literature and informational material. They should also be proficient in adding, subtracting, multiplying, and dividing fractions and decimals, as well as solving multi-step word problems. The 5th Grade MAP test measures how well students can apply their reading, language, and math skills to real-world situations.
| Percentile | Math | Language Usage | Reading | |
|---|---|---|---|---|
| Higher Achievement |
95 84 69 |
234 224 217 |
228 219 211 |
231 221 213 |
| Median and Mean | 50 | 209 | 204 | 204 |
| Lower Achievement | 31 16 5 |
202 194 184 |
197 190 180 |
196 188 178 |
- Deep analysis of texts, understanding geometry, and beginning algebra.
- Students develop their ability to think critically, enhancing their skills in dissecting texts and solving complex math problems that involve algebra and geometry.
- Teachers use the results from this test to pinpoint where students might be struggling and customize their teaching methods to better support each student’s learning journey and academic development.
NWEA MAP Test Scores – 6th Grade.
In sixth grade, students delve into analyzing a diverse array of texts and start to grasp literary elements like metaphors and symbolism. They’re also expected to handle rational numbers and tackle more intricate algebraic equations. The 6th Grade MAP test evaluates how well students understand and can apply their skills in reading, language usage, and mathematics, with a strong focus on critical thinking and solving problems.
| Percentile | Math | Language Usage | Reading | |
|---|---|---|---|---|
| Higher Achievement |
95 84 69 |
241 231 223 |
233 224 217 |
237 227 218 |
| Median and Mean | 50 | 215 | 209 | 210 |
| Lower Achievement | 31 16 5 |
207 199 188 |
202 195 186 |
202 194 183 |
- Advanced reading comprehension, foundational algebra, and analytical skills.
- Students enhance their reading abilities by understanding deeper literary concepts and expand their math skills into pre-algebra, working with ratios, proportions, and integers.
- Teachers use the test results to pinpoint where students need more help, tailoring their teaching to meet these needs and support each student’s academic progress.
NWEA MAP Test Scores – 7th Grade.
By the end of seventh grade, students are expected to be able to read and critically analyze complex texts, which include both primary and secondary sources. They should also be proficient at solving multi-step algebraic equations and understanding fundamental concepts in geometry and probability. The 7th Grade MAP test evaluates students in these areas, with a strong emphasis on higher-level thinking and analytical skills.
| Percentile | Math | Language Usage | Reading | |
|---|---|---|---|---|
| Higher Achievement |
95 84 69 |
249 238 229 |
237 227 220 |
241 231 222 |
| Median and Mean | 50 | 220 | 213 | 214 |
| Lower Achievement | 31 16 5 |
212 203 192 |
205 198 188 |
206 198 187 |
- Advanced text analysis, foundational algebra, and basic scientific reasoning.
- Students are tasked with understanding complex algebraic concepts and starting to develop their ability to reason scientifically.
- The data from the test provides educators with the insights needed to pinpoint where students may need more focused instruction, allowing them to tailor their teaching strategies to better support each student’s learning and growth.
NWEA MAP Test Scores – 8th Grade.
In eighth grade, students are expected to tackle and analyze a broad range of complex texts, including fiction, non-fiction, and poetry. They also need to solve increasingly complex algebraic equations and grasp basic concepts in geometry and probability. The 8th Grade MAP test assesses these skills, preparing students for the academic challenges of high school. The reading portion of the test particularly focuses on deep text analysis, interpreting figurative language, and understanding different literary genres.
| Percentile | Math | Language Usage | Reading | |
|---|---|---|---|---|
| Higher Achievement |
95 84 69 |
256 244 234 |
240 230 223 |
246 235 226 |
| Median and Mean | 50 | 225 | 216 | 218 |
| Lower Achievement | 31 16 5 |
216 206 194 |
208 201 191 |
210 201 190 |
- Advanced understanding of algebra, geometry, and scientific reasoning.
- Students hone their higher-order thinking skills, getting ready for more rigorous high school coursework.
- Teachers use the insights gained from the test data to devise targeted learning plans that address specific areas of need and promote continued academic growth.
How are NWEA MAP Scores Calculated?
NWEA MAP scores are calculated using the RIT scale through a computer-adaptive testing process. As a student takes a test, each answer helps the software adjust the difficulty of the next question. If a student answers correctly, the next question will be more challenging; if incorrect, the next question will be easier. This adaptive approach helps create a detailed and accurate profile of a student’s strengths and weaknesses in different subject areas. The final score represents a student’s achievement level at any given moment and can be compared across testing periods to measure growth.
The NWEA MAP scores by grade level for 2024 and 2025 are based on the 2020 NWEA norms. If NWEA update their norms scores, we will also update this page.
What Do the Different NWEA MAP Scores Mean?
NWEA MAP scores provide insights into a student’s academic abilities in specific areas. Here’s a general idea of what these scores might indicate:
- Below Average Scores: May suggest that a student needs additional support in the subject area to reach grade-level expectations.
- Average Scores: Generally indicate that a student is performing at a level typical for their grade, but they may still benefit from targeted learning opportunities to address specific gaps.
- Above Average Scores: Often reflect strong understanding and capability in the subject area, suggesting readiness for more advanced learning material.
The NWEA Map scores help teachers and educators to:
- Identify students who may need intervention or enrichment.
- Track academic growth over time, determining the effectiveness of instruction and interventions.
- Plan instruction by providing detailed insights into specific areas where a student might struggle or excel.
By comparing a student’s scores from one period to the next, educators can also assess growth, which helps in adapting teaching strategies and resources to better meet each student’s needs.
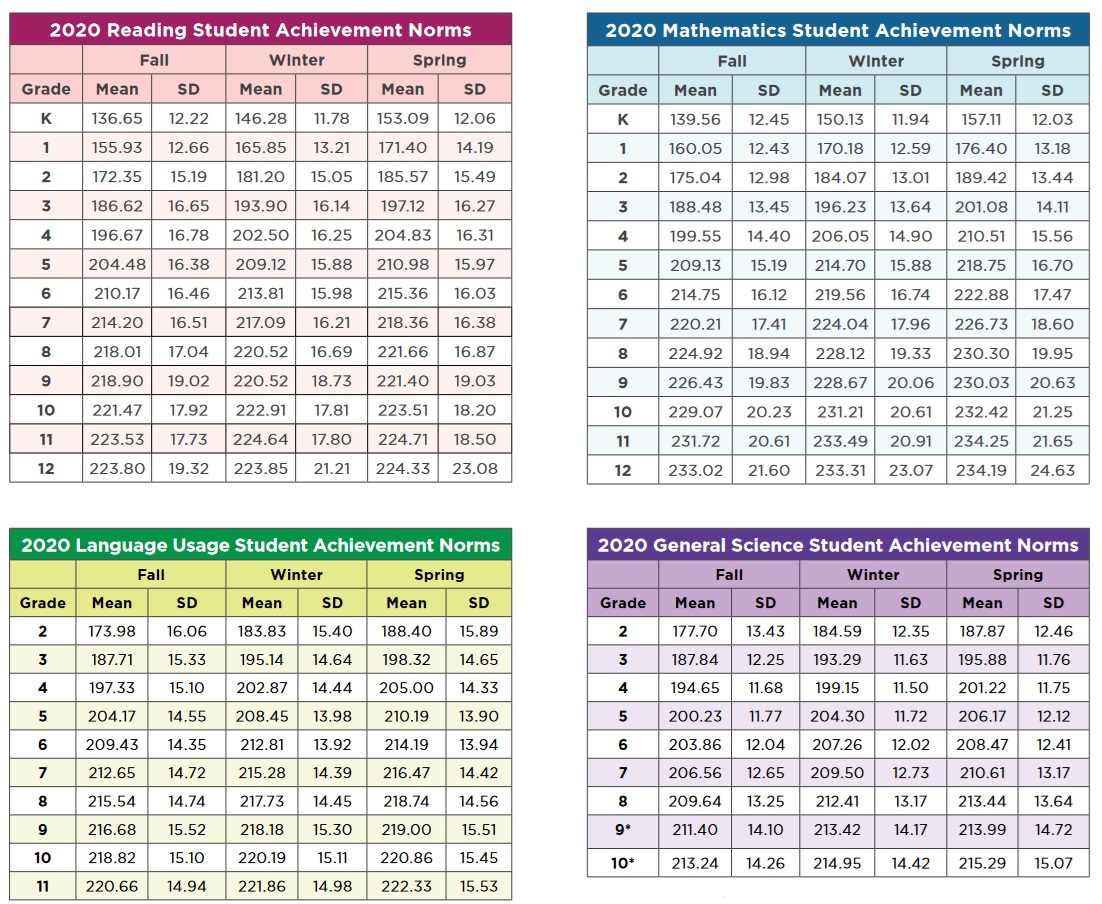
Above you can see the NWEA Map Test Scores Norms Chart from 2020. The 2024 and 2025 NWEA scores are still based on these numbers. These are the average (Mean) national US scores, for Reading, Mathematics, Language and General Science scores results, for Grade 1 to 12, Fall, Winter and Spring scores.
Notice, how the mean scores increase throughout the school years, as they should.
‘SD’ means ´Standart Deviation’. The standard deviation in NWEA refers to the spread of scores within a group of students. A lower standard deviation means that the students’ scores are more closely clustered around the average, while a higher standard deviation indicates a wider range of scores, with some students performing significantly higher or lower than the average.
NWEA MAP Testing Scores – FAQ.
What is the NWEA rating scale?
The NWEA rating scale, commonly referred to as the RIT (Rasch Unit) scale, is an equal-interval scale used in MAP testing to measure a student’s academic progress and capabilities. The RIT scale is designed so that each point on the scale represents the same amount of growth in learning, regardless of where the student begins. This makes it a precise tool for measuring student progress and growth across various academic subjects.
What is an acceptable MAP score?
An acceptable MAP score varies depending on grade level, subject, and the academic standards of a specific school or district. Generally, scores that fall at or above the mean or median of the school or district’s norms are considered acceptable. Educators often use national or local percentile ranks to evaluate where a student’s score falls relative to peers.
What are the NWEA goal ranges?
NWEA goal ranges are specific benchmarks set for students to achieve by the end of a testing period. These ranges vary by grade and subject and are designed to align with curriculum standards. Teachers and educators use these goal ranges to help set targets for instruction and to measure student progress towards academic goals.
How to check MAP scores?
MAP scores are typically accessed through the NWEA portal provided to schools that administer the test. Teachers, administrators, and often parents, can log in to view detailed reports about student performance, including scores, percentile ranks, and growth projections.
Is a NWEA MAP Score of 90 good? Is a MAP of 80 bad?
MAP scores are interpreted based on the percentile rank that corresponds with the score. A score in the 90th percentile is usually considered excellent as it implies a higher performance compared to peers. Conversely, a score in the 80th percentile is also above average in some contexts and subjects. Understanding whether a score is “good” or “bad” depends on the percentile rank and the norm group data.
When reading the NWEA Map Charts on this page, page attention to both the nominal score, for example a RIT score of 172 in mathematics in the 1st grade is a score in the 84th percentile, meaning the students score is better than 83% percent of the other students’ scores. If a 100 student took the test, the student would have scored higher than 83 other students. So, an above average score.
What is a perfect score on NWEA? What is the 100% on NWEA?
There is no “perfect” score on the NWEA MAP tests as the RIT scale does not have an upper limit. The highest scores observed tend to be around 300 RIT points for higher grades in specific subjects. A 100% would not be an applicable concept for RIT scores, as the assessment measures performance on a continuous scale without a defined maximum.
What does the standard deviation of NWEA mean?
The standard deviation in NWEA scores indicates how much scores within a group vary or deviate from the average score. A low standard deviation means that the scores are closely clustered around the average, indicating consistency among the group’s abilities. A high standard deviation suggests greater diversity in the scores and abilities.
What is a good standard deviation score?
A “good” standard deviation score isn’t necessarily about being high or low but rather how well it reflects the range of abilities among students within a group. For educational assessments, a smaller standard deviation could be preferable as it implies more uniform mastery of the content among students.
What is the standard error for the MAP test? What is a normal standard deviation for test scores?
The standard error for the MAP test provides a measure of the accuracy of a student’s RIT score, indicating the range within which the true score is likely to fall. A typical standard error might range from 2 to 3 RIT points. Normal standard deviation for test scores varies, but it’s generally around 10-15 RIT points, which reflects a typical spread of student achievement in a subject.
What is a good NWEA MAP Test score?
A good MAP score is one that meets or exceeds the goal ranges set for a student’s grade level and subject. This corresponds with scores at or above the median percentile ranks for the student’s age and grade, reflecting adequate progress. A NWEA Map Test Reading score of 165 is considered very good in Grade 1, but poor in Grade 3. See the chart.
What is a good NWEA MAP Test math score?
A “good” NWEA math score depends on the student’s grade level. For instance, in 5th grade, a score of 230 or higher might be considered above average, while for 8th grade, a score of 250 or higher may indicate high achievement.
What are the NWEA color ranges?
The NWEA color ranges are often used to visually represent students’ performance relative to national norms:
- Red: Significantly below grade level.
- Yellow: Below grade level, but close.
- Green: At or near grade level.
- Blue: Above grade level. These colors help teachers quickly identify students who may need additional support or challenges.
RIT scores are expected to increase over time. Scores of students in lower grades tend to increase more quickly than those of students in higher grades due to the increased level of difficulty of the higher grade-level tests. RIT scores generally range between 140 and 300. In third grade, students usually score anywhere between 140 and 190, and in higher grade levels they may progress to a score between 240 and 300.
What is the NWEA percentile range?
The NWEA percentile range expresses how a student’s score compares with others in the same grade nationally. Percentiles range from 1 to 99, with higher numbers indicating a higher ranking among peers.
What does low growth high achievement mean?
Low growth high achievement refers to students who score well on assessments, placing them at high achievement levels, but show little or no academic growth compared to previous tests. This situation can suggest that the student is not being sufficiently challenged at their current level of instruction.
What is a Gifted map score?
A ‘gifted’ student Fall MAP score of 90% or higher will be enough to be considered for Gifted programs. In 1st and 2nd grade, the Winter MAP scores can be used as well. It does not mean that the student will qualify for a Gifted program. It is a starting point for the process.