
NWEA Map Test Scores by Grade Level 2026 [Percentile Charts]
NWEA Map Test Scores by Grade Level 2026 (Percentile Charts for 2025-2026)
These are the updated NWEA Map Scores Norms Charts with Percentiles for 2025-2026. Learn how to interpret NWEA MAP test scores, including RIT scores, Map Score charts by grade level, and percentile scores. This is how you track your child’s progress easily.
Table B.1. NWEA Map Scores by Grade Level 2026 Math Norms – Fall Test for Students (2025-2026) – Achievement Percentiles – (Mathematics, Fall, Student)
| Pct | K | 1 | 2 | 3 | 4 | 5 | 6 | 7 | 8 | 9 | 10 | 11 | 12 | Pct |
|---|---|---|---|---|---|---|---|---|---|---|---|---|---|---|
| 5 | 121 | 137 | 147 | 158 | 171 | 180 | 184 | 189 | 192 | 196 | 196 | 195 | 194 | 5 |
| 10 | 125 | 142 | 153 | 164 | 177 | 185 | 190 | 195 | 199 | 202 | 203 | 203 | 201 | 10 |
| 15 | 128 | 145 | 157 | 168 | 181 | 189 | 194 | 199 | 203 | 207 | 208 | 208 | 206 | 15 |
| 20 | 131 | 148 | 160 | 171 | 184 | 193 | 197 | 203 | 207 | 210 | 211 | 212 | 211 | 20 |
| 25 | 133 | 150 | 162 | 174 | 186 | 195 | 199 | 206 | 210 | 213 | 214 | 215 | 214 | 25 |
| 30 | 135 | 152 | 165 | 176 | 189 | 198 | 202 | 208 | 212 | 216 | 217 | 218 | 217 | 30 |
| 35 | 136 | 154 | 167 | 178 | 191 | 200 | 204 | 211 | 215 | 218 | 220 | 221 | 220 | 35 |
| 40 | 138 | 156 | 169 | 180 | 193 | 202 | 206 | 213 | 217 | 220 | 222 | 224 | 223 | 40 |
| 45 | 140 | 158 | 171 | 182 | 195 | 204 | 208 | 215 | 220 | 223 | 224 | 227 | 226 | 45 |
| 50 | 141 | 159 | 173 | 184 | 197 | 206 | 210 | 217 | 222 | 225 | 227 | 229 | 228 | 50 |
| 55 | 143 | 161 | 175 | 186 | 199 | 208 | 212 | 219 | 224 | 227 | 229 | 232 | 231 | 55 |
| 60 | 144 | 163 | 177 | 188 | 201 | 210 | 214 | 222 | 227 | 229 | 232 | 234 | 233 | 60 |
| 65 | 146 | 164 | 179 | 190 | 203 | 212 | 216 | 224 | 229 | 232 | 234 | 237 | 236 | 65 |
| 70 | 148 | 166 | 181 | 192 | 205 | 215 | 219 | 226 | 232 | 234 | 237 | 240 | 239 | 70 |
| 75 | 149 | 168 | 183 | 195 | 208 | 217 | 221 | 229 | 234 | 237 | 239 | 243 | 242 | 75 |
| 80 | 152 | 171 | 186 | 197 | 210 | 220 | 224 | 232 | 237 | 240 | 242 | 246 | 246 | 80 |
| 85 | 154 | 173 | 189 | 200 | 214 | 223 | 227 | 235 | 241 | 243 | 246 | 250 | 250 | 85 |
| 90 | 157 | 176 | 193 | 204 | 217 | 227 | 231 | 239 | 246 | 248 | 251 | 255 | 255 | 90 |
| 95 | 161 | 181 | 198 | 210 | 223 | 233 | 237 | 246 | 252 | 254 | 257 | 263 | 263 | 95 |
Table B.2. NWEA Map Scores by Grade Level 2026 Math Norms – Fall Test for Schools (2025-2026) – Achievement Percentiles – (Mathematics, Fall, School)
| Pct | K | 1 | 2 | 3 | 4 | 5 | 6 | 7 | 8 | 9 | 10 | 11 | 12 | Pct |
|---|---|---|---|---|---|---|---|---|---|---|---|---|---|---|
| 5 | 133 | 150 | 162 | 172 | 185 | 193 | 197 | 202 | 205 | 206 | 206 | 208 | 205 | 5 |
| 10 | 135 | 152 | 164 | 175 | 187 | 196 | 200 | 205 | 208 | 210 | 210 | 212 | 209 | 10 |
| 15 | 136 | 154 | 166 | 177 | 189 | 198 | 202 | 208 | 211 | 213 | 213 | 215 | 212 | 15 |
| 20 | 137 | 155 | 167 | 178 | 190 | 199 | 203 | 209 | 212 | 215 | 215 | 217 | 215 | 20 |
| 25 | 138 | 156 | 169 | 179 | 192 | 201 | 205 | 211 | 214 | 217 | 217 | 219 | 216 | 25 |
| 30 | 139 | 157 | 170 | 180 | 193 | 202 | 206 | 212 | 215 | 218 | 219 | 221 | 218 | 30 |
| 35 | 140 | 157 | 171 | 181 | 194 | 203 | 207 | 213 | 217 | 220 | 221 | 223 | 220 | 35 |
| 40 | 140 | 158 | 171 | 182 | 194 | 204 | 208 | 214 | 218 | 221 | 222 | 224 | 221 | 40 |
| 45 | 141 | 159 | 172 | 183 | 195 | 205 | 209 | 215 | 219 | 223 | 224 | 226 | 223 | 45 |
| 50 | 142 | 159 | 173 | 184 | 196 | 206 | 210 | 217 | 220 | 224 | 225 | 227 | 224 | 50 |
| 55 | 142 | 160 | 174 | 185 | 197 | 207 | 211 | 218 | 222 | 225 | 227 | 229 | 226 | 55 |
| 60 | 143 | 161 | 175 | 186 | 198 | 208 | 212 | 219 | 223 | 227 | 228 | 230 | 227 | 60 |
| 65 | 144 | 162 | 176 | 187 | 199 | 209 | 213 | 220 | 224 | 228 | 230 | 232 | 229 | 65 |
| 70 | 145 | 162 | 177 | 188 | 200 | 210 | 214 | 221 | 226 | 230 | 231 | 233 | 231 | 70 |
| 75 | 145 | 163 | 178 | 189 | 201 | 211 | 215 | 222 | 227 | 231 | 233 | 235 | 232 | 75 |
| 80 | 146 | 164 | 179 | 190 | 202 | 212 | 216 | 224 | 229 | 233 | 235 | 237 | 234 | 80 |
| 85 | 147 | 165 | 181 | 192 | 203 | 214 | 218 | 226 | 230 | 235 | 237 | 239 | 237 | 85 |
| 90 | 149 | 167 | 182 | 193 | 205 | 215 | 220 | 228 | 233 | 238 | 240 | 242 | 240 | 90 |
| 95 | 151 | 169 | 185 | 196 | 208 | 218 | 222 | 231 | 236 | 242 | 244 | 246 | 244 | 95 |
Table B.3. NWEA Map Scores by Grade Level 2026 Math Norms – Winter Test for Students -(2025-2026) – Achievement Percentiles – (Mathematics, Winter, Student)
| Pct | K | 1 | 2 | 3 | 4 | 5 | 6 | 7 | 8 | 9 | 10 | 11 | 12 | Pct |
|---|---|---|---|---|---|---|---|---|---|---|---|---|---|---|
| 5 | 130 | 146 | 155 | 166 | 176 | 183 | 187 | 191 | 194 | 196 | 196 | 195 | 194 | 5 |
| 10 | 135 | 151 | 161 | 172 | 183 | 189 | 194 | 197 | 201 | 203 | 204 | 203 | 202 | 10 |
| 15 | 138 | 154 | 165 | 176 | 187 | 194 | 198 | 202 | 206 | 207 | 208 | 209 | 207 | 15 |
| 20 | 140 | 157 | 168 | 179 | 190 | 197 | 201 | 206 | 210 | 211 | 212 | 213 | 211 | 20 |
| 25 | 142 | 159 | 171 | 182 | 193 | 200 | 204 | 209 | 213 | 214 | 216 | 217 | 215 | 25 |
| 30 | 144 | 161 | 173 | 184 | 196 | 203 | 207 | 211 | 216 | 217 | 219 | 220 | 218 | 30 |
| 35 | 146 | 163 | 175 | 186 | 198 | 205 | 209 | 214 | 219 | 220 | 222 | 223 | 221 | 35 |
| 40 | 147 | 165 | 177 | 189 | 200 | 207 | 212 | 216 | 221 | 222 | 224 | 226 | 224 | 40 |
| 45 | 149 | 167 | 179 | 191 | 202 | 210 | 214 | 219 | 224 | 225 | 227 | 229 | 227 | 45 |
| 50 | 151 | 168 | 181 | 193 | 204 | 212 | 216 | 221 | 226 | 227 | 229 | 231 | 230 | 50 |
| 55 | 152 | 170 | 183 | 195 | 207 | 214 | 218 | 223 | 228 | 230 | 232 | 234 | 233 | 55 |
| 60 | 154 | 172 | 185 | 197 | 209 | 216 | 220 | 226 | 231 | 232 | 235 | 237 | 235 | 60 |
| 65 | 155 | 174 | 187 | 199 | 211 | 219 | 223 | 228 | 233 | 235 | 237 | 240 | 238 | 65 |
| 70 | 157 | 176 | 189 | 201 | 213 | 221 | 225 | 231 | 236 | 237 | 240 | 243 | 241 | 70 |
| 75 | 159 | 178 | 192 | 204 | 216 | 224 | 228 | 233 | 239 | 240 | 243 | 246 | 245 | 75 |
| 80 | 161 | 180 | 194 | 206 | 219 | 226 | 231 | 236 | 242 | 243 | 246 | 250 | 248 | 80 |
| 85 | 164 | 183 | 197 | 210 | 222 | 230 | 234 | 240 | 246 | 247 | 250 | 254 | 252 | 85 |
| 90 | 167 | 186 | 201 | 214 | 226 | 234 | 238 | 245 | 251 | 252 | 255 | 259 | 258 | 90 |
| 95 | 171 | 191 | 207 | 220 | 232 | 240 | 245 | 251 | 258 | 259 | 263 | 267 | 266 | 95 |
Table B.4. NWEA Map Scores by Grade Level 2026 Math Norms – Winter Test for Schools (2025-2026) – Achievement Percentiles – (Mathematics, Winter, School)
| Pct | K | 1 | 2 | 3 | 4 | 5 | 6 | 7 | 8 | 9 | 10 | 11 | 12 | Pct |
|---|---|---|---|---|---|---|---|---|---|---|---|---|---|---|
| 5 | 142 | 158 | 169 | 180 | 190 | 197 | 201 | 205 | 207 | 208 | 207 | 208 | 206 | 5 |
| 10 | 144 | 161 | 172 | 182 | 193 | 200 | 204 | 208 | 211 | 212 | 212 | 213 | 211 | 10 |
| 15 | 145 | 162 | 174 | 184 | 195 | 202 | 206 | 210 | 213 | 215 | 215 | 216 | 214 | 15 |
| 20 | 146 | 163 | 175 | 186 | 197 | 204 | 208 | 212 | 215 | 217 | 217 | 218 | 216 | 20 |
| 25 | 147 | 164 | 177 | 187 | 198 | 205 | 209 | 214 | 217 | 219 | 219 | 220 | 218 | 25 |
| 30 | 148 | 165 | 178 | 188 | 199 | 206 | 211 | 215 | 219 | 220 | 221 | 222 | 220 | 30 |
| 35 | 149 | 166 | 179 | 189 | 200 | 208 | 212 | 217 | 220 | 222 | 223 | 224 | 222 | 35 |
| 40 | 150 | 167 | 180 | 190 | 201 | 209 | 213 | 218 | 221 | 223 | 224 | 226 | 223 | 40 |
| 45 | 150 | 168 | 181 | 191 | 202 | 210 | 214 | 219 | 223 | 225 | 226 | 227 | 225 | 45 |
| 50 | 151 | 168 | 181 | 192 | 203 | 211 | 215 | 220 | 224 | 226 | 227 | 229 | 226 | 50 |
| 55 | 152 | 169 | 182 | 193 | 204 | 212 | 216 | 221 | 225 | 228 | 229 | 230 | 228 | 55 |
| 60 | 152 | 170 | 183 | 194 | 205 | 213 | 218 | 223 | 227 | 229 | 230 | 232 | 229 | 60 |
| 65 | 153 | 171 | 184 | 195 | 207 | 214 | 219 | 224 | 228 | 230 | 232 | 234 | 231 | 65 |
| 70 | 154 | 172 | 185 | 197 | 208 | 216 | 220 | 225 | 229 | 232 | 234 | 235 | 233 | 70 |
| 75 | 155 | 172 | 186 | 198 | 209 | 217 | 221 | 227 | 231 | 234 | 236 | 237 | 234 | 75 |
| 80 | 156 | 173 | 188 | 199 | 210 | 218 | 223 | 228 | 233 | 235 | 238 | 239 | 236 | 80 |
| 85 | 157 | 175 | 189 | 201 | 212 | 220 | 225 | 230 | 235 | 238 | 240 | 242 | 239 | 85 |
| 90 | 158 | 176 | 191 | 203 | 214 | 222 | 227 | 232 | 237 | 240 | 243 | 245 | 242 | 90 |
| 95 | 160 | 178 | 193 | 205 | 217 | 226 | 230 | 236 | 241 | 244 | 247 | 249 | 246 | 95 |
Table B.5. NWEA Map Scores by Grade Level 2026 Spring Norms – Spring Test for Students (2025-2026) – Achievement Percentiles – (Mathematics, Spring, Student)
| Pct | K | 1 | 2 | 3 | 4 | 5 | 6 | 7 | 8 | 9 | 10 | 11 | 12 | Pct |
|---|---|---|---|---|---|---|---|---|---|---|---|---|---|---|
| 5 | 136 | 151 | 161 | 171 | 180 | 186 | 190 | 192 | 196 | 194 | 195 | 195 | 193 | 5 |
| 10 | 141 | 157 | 167 | 177 | 187 | 192 | 197 | 199 | 203 | 202 | 203 | 203 | 201 | 10 |
| 15 | 144 | 160 | 171 | 181 | 191 | 197 | 201 | 204 | 208 | 207 | 208 | 209 | 207 | 15 |
| 20 | 147 | 163 | 174 | 185 | 195 | 200 | 205 | 208 | 212 | 211 | 213 | 214 | 212 | 20 |
| 25 | 149 | 165 | 177 | 188 | 198 | 204 | 208 | 211 | 215 | 215 | 216 | 217 | 215 | 25 |
| 30 | 151 | 167 | 179 | 190 | 201 | 206 | 211 | 214 | 218 | 218 | 220 | 221 | 219 | 30 |
| 35 | 153 | 169 | 181 | 193 | 203 | 209 | 213 | 216 | 221 | 221 | 223 | 224 | 222 | 35 |
| 40 | 154 | 171 | 183 | 195 | 206 | 211 | 216 | 219 | 224 | 223 | 226 | 227 | 225 | 40 |
| 45 | 156 | 173 | 185 | 197 | 208 | 214 | 218 | 221 | 226 | 226 | 229 | 230 | 228 | 45 |
| 50 | 158 | 175 | 187 | 199 | 210 | 216 | 220 | 224 | 229 | 229 | 231 | 233 | 231 | 50 |
| 55 | 159 | 177 | 189 | 201 | 212 | 218 | 223 | 226 | 231 | 231 | 234 | 236 | 234 | 55 |
| 60 | 161 | 179 | 192 | 203 | 215 | 221 | 225 | 229 | 234 | 234 | 237 | 239 | 237 | 60 |
| 65 | 163 | 181 | 194 | 206 | 217 | 223 | 227 | 231 | 237 | 237 | 240 | 242 | 240 | 65 |
| 70 | 165 | 183 | 196 | 208 | 220 | 226 | 230 | 234 | 239 | 240 | 243 | 245 | 243 | 70 |
| 75 | 167 | 185 | 198 | 211 | 222 | 228 | 233 | 237 | 242 | 243 | 246 | 249 | 247 | 75 |
| 80 | 169 | 187 | 201 | 213 | 225 | 232 | 236 | 240 | 246 | 247 | 250 | 252 | 251 | 80 |
| 85 | 171 | 190 | 204 | 217 | 229 | 235 | 239 | 244 | 250 | 251 | 254 | 257 | 255 | 85 |
| 90 | 174 | 193 | 208 | 221 | 233 | 240 | 244 | 249 | 255 | 256 | 260 | 263 | 261 | 90 |
| 95 | 179 | 199 | 214 | 227 | 240 | 246 | 251 | 256 | 262 | 263 | 268 | 271 | 269 | 95 |
Table B.6. NWEA Map Scores by Grade Level 2026 Math Norms – Spring Test for Schools (2025-2026) – Achievement Percentiles – (Mathematics, Spring, School)
| Pct | K | 1 | 2 | 3 | 4 | 5 | 6 | 7 | 8 | 9 | 10 | 11 | 12 | Pct |
|---|---|---|---|---|---|---|---|---|---|---|---|---|---|---|
| 5 | 148 | 165 | 175 | 185 | 193 | 199 | 203 | 207 | 209 | 209 | 208 | 208 | 206 | 5 |
| 10 | 150 | 167 | 178 | 188 | 197 | 202 | 206 | 210 | 213 | 213 | 213 | 213 | 211 | 10 |
| 15 | 152 | 168 | 180 | 190 | 199 | 205 | 209 | 213 | 216 | 216 | 216 | 216 | 214 | 15 |
| 20 | 153 | 170 | 181 | 192 | 201 | 207 | 211 | 215 | 218 | 218 | 218 | 219 | 217 | 20 |
| 25 | 154 | 171 | 183 | 193 | 202 | 208 | 212 | 216 | 220 | 220 | 220 | 221 | 219 | 25 |
| 30 | 155 | 172 | 184 | 194 | 204 | 210 | 214 | 218 | 221 | 222 | 222 | 223 | 221 | 30 |
| 35 | 156 | 173 | 185 | 196 | 205 | 211 | 215 | 219 | 223 | 223 | 224 | 225 | 223 | 35 |
| 40 | 156 | 173 | 186 | 197 | 206 | 213 | 217 | 220 | 224 | 225 | 226 | 227 | 224 | 40 |
| 45 | 157 | 174 | 187 | 198 | 208 | 214 | 218 | 222 | 225 | 226 | 227 | 228 | 226 | 45 |
| 50 | 158 | 175 | 188 | 199 | 209 | 215 | 219 | 223 | 227 | 228 | 229 | 230 | 228 | 50 |
| 55 | 159 | 176 | 189 | 200 | 210 | 216 | 221 | 224 | 228 | 229 | 231 | 232 | 229 | 55 |
| 60 | 159 | 177 | 190 | 201 | 211 | 218 | 222 | 226 | 229 | 231 | 232 | 233 | 231 | 60 |
| 65 | 160 | 177 | 190 | 202 | 212 | 219 | 223 | 227 | 231 | 232 | 234 | 235 | 232 | 65 |
| 70 | 161 | 178 | 192 | 203 | 214 | 220 | 225 | 228 | 232 | 234 | 236 | 237 | 234 | 70 |
| 75 | 162 | 179 | 193 | 204 | 215 | 222 | 226 | 230 | 234 | 235 | 238 | 239 | 236 | 75 |
| 80 | 163 | 180 | 194 | 206 | 217 | 224 | 228 | 231 | 236 | 237 | 240 | 241 | 238 | 80 |
| 85 | 164 | 182 | 195 | 207 | 219 | 226 | 230 | 233 | 238 | 239 | 242 | 244 | 241 | 85 |
| 90 | 165 | 183 | 197 | 210 | 221 | 228 | 232 | 236 | 240 | 242 | 245 | 247 | 244 | 90 |
| 95 | 167 | 186 | 200 | 213 | 224 | 232 | 236 | 239 | 244 | 246 | 250 | 252 | 249 | 95 |
Table B.7. NWEA Map Scores by Grade Level 2026 Reading Norms – Fall Test for Students (2025-2026) – Achievement Percentiles – (Reading, Fall, Student)
| Pct | K | 1 | 2 | 3 | 4 | 5 | 6 | 7 | 8 | 9 | 10 | 11 | 12 | Pct |
|---|---|---|---|---|---|---|---|---|---|---|---|---|---|---|
| 5 | 123 | 134 | 142 | 155 | 166 | 175 | 181 | 185 | 188 | 186 | 188 | 188 | 187 | 5 |
| 10 | 126 | 139 | 148 | 161 | 173 | 181 | 187 | 191 | 194 | 193 | 195 | 195 | 193 | 10 |
| 15 | 128 | 142 | 152 | 166 | 177 | 186 | 191 | 195 | 198 | 197 | 199 | 199 | 198 | 15 |
| 20 | 130 | 145 | 156 | 169 | 181 | 189 | 195 | 198 | 201 | 201 | 203 | 203 | 202 | 20 |
| 25 | 132 | 147 | 159 | 172 | 184 | 192 | 198 | 201 | 204 | 204 | 206 | 206 | 205 | 25 |
| 30 | 133 | 149 | 161 | 175 | 186 | 195 | 200 | 204 | 207 | 207 | 208 | 209 | 208 | 30 |
| 35 | 134 | 150 | 163 | 178 | 189 | 197 | 202 | 206 | 209 | 209 | 211 | 211 | 210 | 35 |
| 40 | 136 | 152 | 166 | 180 | 191 | 199 | 205 | 208 | 211 | 212 | 213 | 214 | 213 | 40 |
| 45 | 137 | 154 | 168 | 182 | 194 | 201 | 207 | 210 | 214 | 214 | 215 | 216 | 215 | 45 |
| 50 | 138 | 155 | 170 | 185 | 196 | 204 | 209 | 212 | 216 | 216 | 218 | 218 | 218 | 50 |
| 55 | 139 | 157 | 172 | 187 | 198 | 206 | 211 | 214 | 218 | 218 | 220 | 220 | 220 | 55 |
| 60 | 140 | 159 | 174 | 189 | 200 | 208 | 213 | 217 | 220 | 221 | 222 | 223 | 222 | 60 |
| 65 | 142 | 160 | 177 | 192 | 203 | 210 | 215 | 219 | 222 | 223 | 225 | 225 | 225 | 65 |
| 70 | 143 | 162 | 179 | 194 | 205 | 213 | 218 | 221 | 225 | 226 | 227 | 228 | 228 | 70 |
| 75 | 144 | 164 | 182 | 197 | 208 | 215 | 220 | 224 | 227 | 228 | 230 | 230 | 230 | 75 |
| 80 | 146 | 166 | 184 | 200 | 211 | 218 | 223 | 226 | 230 | 231 | 233 | 233 | 234 | 80 |
| 85 | 148 | 169 | 188 | 204 | 215 | 222 | 226 | 230 | 233 | 235 | 236 | 237 | 237 | 85 |
| 90 | 150 | 172 | 192 | 208 | 219 | 226 | 231 | 234 | 238 | 239 | 241 | 241 | 242 | 90 |
| 95 | 153 | 177 | 198 | 215 | 226 | 232 | 237 | 240 | 244 | 246 | 247 | 248 | 249 | 95 |
Table B.8. NWEA Map Scores by Grade Level 2026 Reading Norms – Fall Test for Schools (2025-2026) – Achievement Percentiles – (Reading, Fall, School)
| Pct | K | 1 | 2 | 3 | 4 | 5 | 6 | 7 | 8 | 9 | 10 | 11 | 12 | Pct |
|---|---|---|---|---|---|---|---|---|---|---|---|---|---|---|
| 5 | 131 | 145 | 158 | 171 | 182 | 190 | 196 | 199 | 202 | 201 | 202 | 200 | 198 | 5 |
| 10 | 132 | 148 | 161 | 174 | 185 | 193 | 199 | 202 | 205 | 205 | 205 | 203 | 202 | 10 |
| 15 | 134 | 149 | 162 | 176 | 187 | 195 | 201 | 204 | 207 | 207 | 207 | 206 | 204 | 15 |
| 20 | 134 | 150 | 164 | 177 | 188 | 196 | 202 | 205 | 208 | 208 | 209 | 208 | 206 | 20 |
| 25 | 135 | 151 | 165 | 179 | 190 | 197 | 203 | 207 | 210 | 210 | 211 | 210 | 208 | 25 |
| 30 | 136 | 152 | 166 | 180 | 191 | 199 | 205 | 208 | 211 | 211 | 212 | 211 | 209 | 30 |
| 35 | 137 | 153 | 167 | 181 | 192 | 200 | 206 | 209 | 212 | 212 | 213 | 212 | 211 | 35 |
| 40 | 137 | 154 | 168 | 182 | 193 | 201 | 207 | 210 | 213 | 214 | 215 | 214 | 212 | 40 |
| 45 | 138 | 155 | 169 | 183 | 194 | 202 | 207 | 211 | 214 | 215 | 216 | 215 | 214 | 45 |
| 50 | 138 | 155 | 170 | 184 | 195 | 203 | 208 | 212 | 215 | 216 | 217 | 216 | 215 | 50 |
| 55 | 139 | 156 | 171 | 185 | 196 | 204 | 209 | 213 | 216 | 217 | 218 | 218 | 216 | 55 |
| 60 | 139 | 157 | 172 | 186 | 197 | 205 | 210 | 214 | 217 | 218 | 219 | 219 | 217 | 60 |
| 65 | 140 | 158 | 173 | 187 | 198 | 206 | 211 | 215 | 218 | 219 | 220 | 220 | 219 | 65 |
| 70 | 141 | 158 | 174 | 189 | 200 | 207 | 212 | 216 | 219 | 220 | 222 | 222 | 220 | 70 |
| 75 | 141 | 159 | 175 | 190 | 201 | 208 | 213 | 217 | 220 | 222 | 223 | 223 | 222 | 75 |
| 80 | 142 | 160 | 176 | 191 | 202 | 210 | 215 | 218 | 222 | 223 | 225 | 225 | 223 | 80 |
| 85 | 143 | 161 | 178 | 193 | 204 | 211 | 216 | 220 | 223 | 225 | 226 | 227 | 225 | 85 |
| 90 | 144 | 163 | 180 | 195 | 206 | 213 | 218 | 221 | 225 | 227 | 229 | 229 | 228 | 90 |
| 95 | 146 | 165 | 182 | 198 | 209 | 216 | 221 | 224 | 228 | 230 | 232 | 233 | 232 | 95 |
Table B.9. NWEA Map Scores by Grade Level 2026 Reading Norms – Winter Test for Students (2025-2026) – Achievement Percentiles – (Reading, Winter, Student)
| Pct | K | 1 | 2 | 3 | 4 | 5 | 6 | 7 | 8 | 9 | 10 | 11 | 12 | Pct |
|---|---|---|---|---|---|---|---|---|---|---|---|---|---|---|
| 5 | 128 | 139 | 149 | 160 | 170 | 178 | 183 | 186 | 189 | 187 | 188 | 188 | 186 | 5 |
| 10 | 132 | 145 | 155 | 167 | 177 | 184 | 189 | 192 | 195 | 194 | 195 | 194 | 192 | 10 |
| 15 | 135 | 148 | 159 | 171 | 181 | 189 | 193 | 196 | 199 | 198 | 199 | 199 | 197 | 15 |
| 20 | 137 | 151 | 162 | 175 | 184 | 192 | 197 | 200 | 203 | 201 | 203 | 203 | 201 | 20 |
| 25 | 139 | 153 | 165 | 178 | 187 | 195 | 199 | 202 | 205 | 205 | 206 | 206 | 204 | 25 |
| 30 | 140 | 155 | 168 | 180 | 190 | 197 | 202 | 205 | 208 | 207 | 209 | 208 | 207 | 30 |
| 35 | 142 | 157 | 170 | 183 | 193 | 200 | 204 | 207 | 210 | 210 | 211 | 211 | 210 | 35 |
| 40 | 143 | 159 | 172 | 185 | 195 | 202 | 206 | 210 | 213 | 212 | 214 | 213 | 212 | 40 |
| 45 | 145 | 161 | 175 | 188 | 197 | 204 | 209 | 212 | 215 | 214 | 216 | 216 | 214 | 45 |
| 50 | 146 | 163 | 177 | 190 | 199 | 206 | 211 | 214 | 217 | 217 | 218 | 218 | 217 | 50 |
| 55 | 147 | 164 | 179 | 192 | 202 | 209 | 213 | 216 | 219 | 219 | 220 | 220 | 219 | 55 |
| 60 | 149 | 166 | 181 | 194 | 204 | 211 | 215 | 218 | 221 | 221 | 223 | 223 | 222 | 60 |
| 65 | 150 | 168 | 183 | 197 | 206 | 213 | 217 | 220 | 223 | 224 | 225 | 225 | 224 | 65 |
| 70 | 152 | 170 | 186 | 199 | 209 | 215 | 219 | 223 | 226 | 226 | 228 | 228 | 227 | 70 |
| 75 | 153 | 172 | 188 | 202 | 211 | 218 | 222 | 225 | 228 | 229 | 230 | 230 | 230 | 75 |
| 80 | 155 | 174 | 191 | 205 | 214 | 221 | 225 | 228 | 231 | 232 | 233 | 233 | 233 | 80 |
| 85 | 157 | 177 | 194 | 209 | 218 | 224 | 228 | 231 | 235 | 236 | 237 | 237 | 237 | 85 |
| 90 | 160 | 181 | 199 | 213 | 222 | 228 | 232 | 235 | 239 | 240 | 241 | 242 | 241 | 90 |
| 95 | 164 | 186 | 205 | 220 | 229 | 235 | 238 | 241 | 245 | 247 | 248 | 248 | 248 | 95 |
Table B.10. NWEA Map Scores by Grade Level 2026 Reading Norms – Winter Test for Schools (2025-2026) – Achievement Percentiles – (Reading, Winter, School)
| Pct | K | 1 | 2 | 3 | 4 | 5 | 6 | 7 | 8 | 9 | 10 | 11 | 12 | Pct |
|---|---|---|---|---|---|---|---|---|---|---|---|---|---|---|
| 5 | 138 | 152 | 164 | 176 | 185 | 192 | 197 | 200 | 203 | 201 | 202 | 199 | 196 | 5 |
| 10 | 140 | 154 | 167 | 179 | 188 | 195 | 200 | 203 | 206 | 205 | 205 | 203 | 200 | 10 |
| 15 | 141 | 156 | 168 | 181 | 190 | 197 | 202 | 205 | 208 | 207 | 207 | 205 | 203 | 15 |
| 20 | 142 | 157 | 170 | 182 | 192 | 198 | 204 | 206 | 209 | 209 | 209 | 207 | 205 | 20 |
| 25 | 143 | 158 | 171 | 184 | 193 | 200 | 205 | 208 | 211 | 210 | 211 | 209 | 207 | 25 |
| 30 | 143 | 159 | 172 | 185 | 194 | 201 | 206 | 209 | 212 | 212 | 212 | 211 | 208 | 30 |
| 35 | 144 | 160 | 174 | 186 | 196 | 202 | 207 | 210 | 213 | 213 | 213 | 212 | 210 | 35 |
| 40 | 145 | 161 | 175 | 187 | 197 | 203 | 208 | 211 | 214 | 214 | 215 | 213 | 211 | 40 |
| 45 | 145 | 162 | 176 | 188 | 198 | 204 | 209 | 212 | 215 | 215 | 216 | 215 | 213 | 45 |
| 50 | 146 | 162 | 177 | 189 | 199 | 205 | 210 | 213 | 216 | 216 | 217 | 216 | 214 | 50 |
| 55 | 147 | 163 | 177 | 190 | 200 | 206 | 211 | 214 | 217 | 217 | 218 | 217 | 215 | 55 |
| 60 | 147 | 164 | 178 | 191 | 201 | 208 | 212 | 215 | 218 | 219 | 219 | 219 | 217 | 60 |
| 65 | 148 | 165 | 180 | 193 | 202 | 209 | 213 | 216 | 219 | 220 | 221 | 220 | 218 | 65 |
| 70 | 149 | 166 | 181 | 194 | 203 | 210 | 214 | 217 | 220 | 221 | 222 | 221 | 220 | 70 |
| 75 | 149 | 167 | 182 | 195 | 204 | 211 | 215 | 218 | 222 | 222 | 223 | 223 | 221 | 75 |
| 80 | 150 | 168 | 183 | 196 | 206 | 212 | 216 | 220 | 223 | 224 | 225 | 225 | 223 | 80 |
| 85 | 151 | 169 | 185 | 198 | 207 | 214 | 218 | 221 | 225 | 226 | 227 | 227 | 225 | 85 |
| 90 | 152 | 171 | 186 | 200 | 209 | 216 | 220 | 223 | 227 | 228 | 229 | 229 | 228 | 90 |
| 95 | 154 | 173 | 189 | 203 | 212 | 219 | 222 | 226 | 230 | 231 | 232 | 233 | 232 | 95 |
Table B.11. NWEA Map Scores by Grade Level 2026 Reading Norms – Spring Norms for Students (2025-2026) – Achievement Percentiles – (Reading, Spring, Student)
| Pct | K | 1 | 2 | 3 | 4 | 5 | 6 | 7 | 8 | 9 | 10 | 11 | 12 | Pct |
|---|---|---|---|---|---|---|---|---|---|---|---|---|---|---|
| 5 | 131 | 142 | 153 | 164 | 173 | 180 | 185 | 187 | 190 | 187 | 188 | 187 | 184 | 5 |
| 10 | 136 | 148 | 159 | 171 | 179 | 186 | 191 | 193 | 196 | 194 | 195 | 194 | 191 | 10 |
| 15 | 139 | 152 | 164 | 175 | 184 | 191 | 195 | 197 | 200 | 198 | 200 | 198 | 196 | 15 |
| 20 | 141 | 155 | 167 | 179 | 187 | 194 | 198 | 201 | 203 | 202 | 203 | 202 | 200 | 20 |
| 25 | 143 | 157 | 170 | 182 | 190 | 197 | 201 | 203 | 206 | 205 | 206 | 205 | 203 | 25 |
| 30 | 145 | 160 | 173 | 184 | 193 | 199 | 203 | 206 | 209 | 208 | 209 | 208 | 206 | 30 |
| 35 | 147 | 162 | 175 | 187 | 195 | 202 | 206 | 208 | 211 | 210 | 211 | 211 | 209 | 35 |
| 40 | 149 | 164 | 177 | 189 | 198 | 204 | 208 | 211 | 213 | 213 | 214 | 213 | 211 | 40 |
| 45 | 150 | 166 | 180 | 192 | 200 | 206 | 210 | 213 | 216 | 215 | 216 | 215 | 214 | 45 |
| 50 | 152 | 168 | 182 | 194 | 202 | 208 | 212 | 215 | 218 | 217 | 218 | 218 | 216 | 50 |
| 55 | 154 | 170 | 184 | 196 | 204 | 211 | 214 | 217 | 220 | 219 | 221 | 220 | 219 | 55 |
| 60 | 155 | 172 | 186 | 198 | 207 | 213 | 216 | 219 | 222 | 222 | 223 | 223 | 221 | 60 |
| 65 | 157 | 174 | 188 | 201 | 209 | 215 | 218 | 221 | 224 | 224 | 225 | 225 | 224 | 65 |
| 70 | 159 | 176 | 191 | 203 | 211 | 217 | 221 | 224 | 227 | 227 | 228 | 228 | 226 | 70 |
| 75 | 161 | 178 | 193 | 206 | 214 | 220 | 223 | 226 | 229 | 230 | 231 | 230 | 229 | 75 |
| 80 | 163 | 181 | 196 | 209 | 217 | 223 | 226 | 229 | 232 | 233 | 234 | 234 | 233 | 80 |
| 85 | 165 | 184 | 200 | 213 | 220 | 226 | 229 | 232 | 236 | 236 | 237 | 237 | 236 | 85 |
| 90 | 168 | 188 | 204 | 217 | 225 | 230 | 233 | 237 | 240 | 241 | 242 | 242 | 241 | 90 |
| 95 | 173 | 193 | 210 | 224 | 231 | 237 | 239 | 243 | 246 | 247 | 248 | 249 | 248 | 95 |
Table B.12. NWEA Map Scores by Grade Level 2026 Reading Norms – Spring Test for Schools (2025-2026) – Achievement Percentiles – (Reading, Spring, School)
| Pct | K | 1 | 2 | 3 | 4 | 5 | 6 | 7 | 8 | 9 | 10 | 11 | 12 | Pct |
|---|---|---|---|---|---|---|---|---|---|---|---|---|---|---|
| 5 | 143 | 156 | 168 | 179 | 187 | 194 | 198 | 201 | 203 | 201 | 201 | 198 | 195 | 5 |
| 10 | 145 | 159 | 171 | 182 | 190 | 197 | 201 | 204 | 206 | 205 | 205 | 202 | 199 | 10 |
| 15 | 146 | 161 | 173 | 184 | 193 | 199 | 203 | 206 | 208 | 207 | 207 | 205 | 202 | 15 |
| 20 | 147 | 162 | 175 | 186 | 194 | 200 | 205 | 207 | 210 | 209 | 209 | 207 | 204 | 20 |
| 25 | 148 | 163 | 176 | 187 | 196 | 202 | 206 | 208 | 211 | 210 | 211 | 209 | 206 | 25 |
| 30 | 149 | 164 | 177 | 189 | 197 | 203 | 207 | 210 | 212 | 212 | 212 | 210 | 208 | 30 |
| 35 | 150 | 165 | 178 | 190 | 198 | 204 | 208 | 211 | 214 | 213 | 213 | 212 | 209 | 35 |
| 40 | 150 | 166 | 179 | 191 | 199 | 205 | 209 | 212 | 215 | 214 | 215 | 213 | 211 | 40 |
| 45 | 151 | 167 | 180 | 192 | 200 | 206 | 210 | 213 | 216 | 215 | 216 | 214 | 212 | 45 |
| 50 | 152 | 168 | 181 | 193 | 201 | 207 | 211 | 214 | 217 | 217 | 217 | 216 | 213 | 50 |
| 55 | 153 | 169 | 182 | 194 | 202 | 208 | 212 | 215 | 218 | 218 | 218 | 217 | 215 | 55 |
| 60 | 153 | 169 | 183 | 195 | 203 | 209 | 213 | 216 | 219 | 219 | 220 | 218 | 216 | 60 |
| 65 | 154 | 170 | 184 | 196 | 205 | 211 | 214 | 217 | 220 | 220 | 221 | 220 | 218 | 65 |
| 70 | 155 | 171 | 186 | 198 | 206 | 212 | 215 | 218 | 221 | 221 | 222 | 221 | 219 | 70 |
| 75 | 156 | 172 | 187 | 199 | 207 | 213 | 216 | 219 | 222 | 223 | 224 | 223 | 221 | 75 |
| 80 | 157 | 173 | 188 | 200 | 208 | 214 | 218 | 221 | 224 | 224 | 225 | 225 | 223 | 80 |
| 85 | 158 | 175 | 190 | 202 | 210 | 216 | 219 | 222 | 225 | 226 | 227 | 227 | 225 | 85 |
| 90 | 159 | 176 | 192 | 204 | 212 | 218 | 221 | 224 | 227 | 228 | 229 | 229 | 228 | 90 |
| 95 | 161 | 179 | 195 | 207 | 215 | 221 | 224 | 227 | 231 | 232 | 233 | 233 | 232 | 95 |
Table B.13. NWEA Map Scores by Grade Level 2026 Language Usage Norms – Fall Test for Students (2025-2026) – Achievement Percentiles – (Language Usage, Fall, Student)
| Pct | K | 1 | 2 | 3 | 4 | 5 | 6 | 7 | 8 | 9 | 10 | 11 | 12 | Pct |
|---|---|---|---|---|---|---|---|---|---|---|---|---|---|---|
| 5 | 124 | 136 | 146 | 157 | 165 | 171 | 175 | 177 | 177 | 178 | 177 | 178 | 178 | 5 |
| 10 | 126 | 139 | 150 | 161 | 170 | 176 | 180 | 182 | 182 | 183 | 183 | 183 | 183 | 10 |
| 15 | 128 | 142 | 153 | 165 | 174 | 179 | 183 | 186 | 187 | 188 | 188 | 188 | 189 | 15 |
| 20 | 129 | 144 | 156 | 168 | 176 | 182 | 186 | 189 | 190 | 191 | 191 | 192 | 192 | 20 |
| 25 | 131 | 146 | 158 | 170 | 179 | 184 | 189 | 191 | 192 | 194 | 194 | 194 | 195 | 25 |
| 30 | 132 | 147 | 160 | 173 | 181 | 186 | 191 | 193 | 194 | 196 | 196 | 197 | 197 | 30 |
| 35 | 133 | 149 | 162 | 174 | 183 | 188 | 193 | 195 | 196 | 198 | 198 | 199 | 199 | 35 |
| 40 | 135 | 150 | 164 | 176 | 185 | 190 | 194 | 197 | 198 | 200 | 201 | 202 | 202 | 40 |
| 45 | 136 | 152 | 165 | 178 | 186 | 192 | 196 | 199 | 200 | 202 | 203 | 204 | 204 | 45 |
| 50 | 137 | 153 | 167 | 180 | 188 | 194 | 198 | 201 | 202 | 205 | 205 | 206 | 206 | 50 |
| 55 | 138 | 155 | 169 | 182 | 190 | 196 | 200 | 203 | 205 | 207 | 208 | 209 | 209 | 55 |
| 60 | 139 | 156 | 171 | 184 | 192 | 198 | 202 | 205 | 207 | 210 | 210 | 211 | 212 | 60 |
| 65 | 140 | 158 | 173 | 186 | 194 | 200 | 204 | 207 | 209 | 212 | 213 | 214 | 214 | 65 |
| 70 | 142 | 160 | 175 | 188 | 196 | 202 | 206 | 209 | 212 | 215 | 216 | 217 | 217 | 70 |
| 75 | 143 | 162 | 178 | 191 | 199 | 205 | 209 | 213 | 215 | 218 | 219 | 220 | 220 | 75 |
| 80 | 145 | 164 | 181 | 194 | 202 | 208 | 213 | 216 | 218 | 221 | 223 | 224 | 224 | 80 |
| 85 | 147 | 167 | 184 | 197 | 205 | 211 | 216 | 219 | 222 | 225 | 227 | 228 | 228 | 85 |
| 90 | 150 | 171 | 188 | 202 | 210 | 216 | 221 | 225 | 227 | 230 | 232 | 233 | 234 | 90 |
| 95 | 154 | 175 | 195 | 209 | 216 | 222 | 228 | 231 | 234 | 238 | 240 | 242 | 242 | 95 |
Table B.14. NWEA Map Scores by Grade Level 2026 Language Usage Norms – Fall Test for Schools (2025-2026) – Achievement Percentiles – (Language Usage, Fall, School)
| Pct | K | 1 | 2 | 3 | 4 | 5 | 6 | 7 | 8 | 9 | 10 | 11 | 12 | Pct |
|---|---|---|---|---|---|---|---|---|---|---|---|---|---|---|
| 5 | 133 | 147 | 159 | 170 | 179 | 185 | 189 | 192 | 193 | 193 | 192 | 193 | 194 | 5 |
| 10 | 134 | 148 | 161 | 172 | 182 | 188 | 193 | 196 | 197 | 197 | 197 | 197 | 198 | 10 |
| 15 | 135 | 150 | 162 | 174 | 184 | 190 | 195 | 198 | 199 | 199 | 199 | 200 | 200 | 15 |
| 20 | 136 | 151 | 163 | 175 | 185 | 192 | 197 | 199 | 201 | 201 | 201 | 202 | 202 | 20 |
| 25 | 137 | 152 | 164 | 176 | 186 | 193 | 198 | 201 | 202 | 202 | 202 | 204 | 204 | 25 |
| 30 | 138 | 152 | 165 | 177 | 188 | 194 | 199 | 202 | 203 | 204 | 204 | 205 | 205 | 30 |
| 35 | 138 | 153 | 166 | 178 | 189 | 195 | 200 | 203 | 204 | 205 | 205 | 206 | 206 | 35 |
| 40 | 139 | 154 | 167 | 179 | 190 | 196 | 201 | 204 | 206 | 206 | 207 | 208 | 208 | 40 |
| 45 | 139 | 155 | 168 | 180 | 191 | 197 | 202 | 205 | 207 | 207 | 209 | 209 | 209 | 45 |
| 50 | 140 | 156 | 169 | 181 | 192 | 199 | 203 | 206 | 208 | 209 | 210 | 210 | 210 | 50 |
| 55 | 141 | 156 | 170 | 182 | 194 | 200 | 204 | 207 | 209 | 210 | 211 | 212 | 212 | 55 |
| 60 | 141 | 157 | 171 | 184 | 195 | 202 | 205 | 208 | 211 | 212 | 213 | 214 | 214 | 60 |
| 65 | 142 | 158 | 172 | 185 | 197 | 203 | 207 | 210 | 212 | 213 | 215 | 216 | 216 | 65 |
| 70 | 143 | 159 | 174 | 187 | 199 | 205 | 208 | 211 | 214 | 215 | 216 | 217 | 218 | 70 |
| 75 | 144 | 160 | 175 | 188 | 200 | 206 | 209 | 213 | 215 | 216 | 218 | 219 | 220 | 75 |
| 80 | 146 | 162 | 177 | 190 | 202 | 209 | 212 | 215 | 217 | 218 | 220 | 222 | 222 | 80 |
| 85 | 148 | 164 | 180 | 193 | 206 | 212 | 215 | 218 | 220 | 222 | 224 | 225 | 226 | 85 |
| 90 | 150 | 167 | 184 | 197 | 210 | 216 | 219 | 222 | 224 | 226 | 227 | 229 | 230 | 90 |
| 95 | 153 | 172 | 190 | 203 | 215 | 221 | 224 | 227 | 229 | 231 | 233 | 234 | 235 | 95 |
Table B.15. NWEA Map Scores by Grade Level 2026 Language Usage Norms – Winter Test for Students (2025-2026) – Achievement Percentiles – (Language Usage, Winter, Student)
| Pct | K | 1 | 2 | 3 | 4 | 5 | 6 | 7 | 8 | 9 | 10 | 11 | 12 | Pct |
|---|---|---|---|---|---|---|---|---|---|---|---|---|---|---|
| 5 | 129 | 141 | 153 | 164 | 171 | 177 | 180 | 182 | 182 | 181 | 181 | 180 | 179 | 5 |
| 10 | 132 | 145 | 158 | 169 | 176 | 182 | 185 | 187 | 187 | 187 | 186 | 186 | 185 | 10 |
| 15 | 135 | 148 | 162 | 173 | 180 | 185 | 189 | 191 | 192 | 192 | 192 | 192 | 191 | 15 |
| 20 | 137 | 150 | 165 | 175 | 183 | 188 | 192 | 194 | 195 | 196 | 196 | 196 | 195 | 20 |
| 25 | 138 | 152 | 167 | 178 | 185 | 191 | 194 | 196 | 198 | 198 | 198 | 199 | 198 | 25 |
| 30 | 140 | 153 | 169 | 180 | 188 | 193 | 196 | 198 | 200 | 201 | 201 | 201 | 201 | 30 |
| 35 | 141 | 155 | 171 | 182 | 190 | 195 | 198 | 200 | 202 | 203 | 203 | 203 | 203 | 35 |
| 40 | 142 | 156 | 172 | 184 | 192 | 197 | 200 | 202 | 205 | 205 | 205 | 205 | 205 | 40 |
| 45 | 143 | 157 | 174 | 186 | 193 | 199 | 202 | 204 | 207 | 207 | 208 | 207 | 207 | 45 |
| 50 | 144 | 158 | 176 | 187 | 195 | 201 | 204 | 206 | 209 | 210 | 210 | 210 | 210 | 50 |
| 55 | 146 | 160 | 178 | 189 | 198 | 203 | 206 | 209 | 212 | 212 | 213 | 213 | 213 | 55 |
| 60 | 147 | 161 | 180 | 191 | 199 | 205 | 209 | 211 | 214 | 215 | 215 | 215 | 216 | 60 |
| 65 | 148 | 163 | 182 | 193 | 202 | 207 | 211 | 214 | 217 | 217 | 218 | 218 | 219 | 65 |
| 70 | 149 | 164 | 184 | 196 | 204 | 210 | 213 | 216 | 220 | 220 | 221 | 221 | 221 | 70 |
| 75 | 151 | 166 | 187 | 198 | 207 | 212 | 216 | 219 | 223 | 223 | 224 | 224 | 225 | 75 |
| 80 | 153 | 169 | 190 | 201 | 210 | 216 | 220 | 223 | 227 | 228 | 228 | 229 | 229 | 80 |
| 85 | 155 | 171 | 194 | 205 | 213 | 220 | 224 | 227 | 231 | 232 | 233 | 233 | 234 | 85 |
| 90 | 158 | 175 | 198 | 209 | 219 | 225 | 229 | 232 | 236 | 238 | 238 | 239 | 240 | 90 |
| 95 | 163 | 180 | 204 | 215 | 225 | 231 | 234 | 238 | 242 | 244 | 245 | 245 | 246 | 95 |
Table B.16. NWEA Map Scores by Grade Level 2026 Language Usage Norms – Winter Test for Schools (2025-2026) – Achievement Percentiles – (Language Usage, Winter, School)
| Pct | K | 1 | 2 | 3 | 4 | 5 | 6 | 7 | 8 | 9 | 10 | 11 | 12 | Pct |
|---|---|---|---|---|---|---|---|---|---|---|---|---|---|---|
| 5 | 140 | 153 | 165 | 176 | 184 | 190 | 194 | 196 | 198 | 197 | 197 | 196 | 195 | 5 |
| 10 | 141 | 154 | 167 | 178 | 186 | 193 | 197 | 199 | 201 | 201 | 200 | 200 | 199 | 10 |
| 15 | 142 | 155 | 168 | 179 | 188 | 194 | 198 | 201 | 203 | 203 | 203 | 203 | 202 | 15 |
| 20 | 143 | 156 | 169 | 181 | 190 | 195 | 200 | 202 | 204 | 204 | 204 | 205 | 204 | 20 |
| 25 | 143 | 157 | 170 | 182 | 191 | 196 | 201 | 203 | 206 | 206 | 206 | 207 | 206 | 25 |
| 30 | 144 | 157 | 171 | 183 | 192 | 198 | 202 | 205 | 207 | 207 | 208 | 208 | 207 | 30 |
| 35 | 144 | 158 | 172 | 184 | 193 | 199 | 203 | 206 | 208 | 209 | 209 | 210 | 209 | 35 |
| 40 | 145 | 159 | 173 | 185 | 194 | 200 | 205 | 207 | 210 | 211 | 211 | 211 | 211 | 40 |
| 45 | 146 | 160 | 174 | 186 | 195 | 201 | 206 | 208 | 211 | 212 | 212 | 213 | 212 | 45 |
| 50 | 147 | 161 | 175 | 188 | 196 | 202 | 207 | 210 | 213 | 213 | 214 | 214 | 214 | 50 |
| 55 | 147 | 162 | 176 | 189 | 198 | 204 | 209 | 211 | 214 | 215 | 216 | 216 | 216 | 55 |
| 60 | 148 | 163 | 177 | 190 | 199 | 205 | 210 | 213 | 216 | 217 | 218 | 218 | 218 | 60 |
| 65 | 149 | 164 | 178 | 191 | 201 | 206 | 212 | 214 | 218 | 219 | 219 | 220 | 220 | 65 |
| 70 | 150 | 165 | 179 | 193 | 202 | 208 | 213 | 216 | 219 | 220 | 221 | 221 | 221 | 70 |
| 75 | 151 | 166 | 181 | 194 | 204 | 209 | 215 | 217 | 221 | 222 | 223 | 224 | 224 | 75 |
| 80 | 152 | 168 | 183 | 197 | 206 | 212 | 217 | 220 | 223 | 224 | 225 | 226 | 226 | 80 |
| 85 | 154 | 170 | 186 | 200 | 209 | 216 | 220 | 223 | 227 | 228 | 229 | 230 | 230 | 85 |
| 90 | 156 | 173 | 190 | 204 | 213 | 220 | 225 | 228 | 231 | 232 | 233 | 234 | 235 | 90 |
| 95 | 159 | 177 | 196 | 209 | 218 | 225 | 230 | 233 | 236 | 238 | 238 | 239 | 240 | 95 |
Table B.17. NWEA Map Scores by Grade Level 2026 Language Usage Norms – Spring Test for Students (2025-2026) – Achievement Percentiles – (Language Usage, Spring, Student)
| Pct | K | 1 | 2 | 3 | 4 | 5 | 6 | 7 | 8 | 9 | 10 | 11 | 12 | Pct |
|---|---|---|---|---|---|---|---|---|---|---|---|---|---|---|
| 5 | 133 | 146 | 158 | 168 | 175 | 180 | 182 | 184 | 184 | 182 | 181 | 180 | 178 | 5 |
| 10 | 137 | 151 | 164 | 174 | 180 | 185 | 188 | 190 | 190 | 188 | 186 | 185 | 184 | 10 |
| 15 | 140 | 155 | 168 | 177 | 184 | 190 | 192 | 194 | 194 | 193 | 191 | 190 | 188 | 15 |
| 20 | 142 | 158 | 171 | 180 | 187 | 193 | 195 | 197 | 198 | 196 | 195 | 193 | 191 | 20 |
| 25 | 144 | 160 | 174 | 182 | 190 | 195 | 198 | 200 | 201 | 200 | 198 | 197 | 196 | 25 |
| 30 | 146 | 162 | 175 | 185 | 192 | 198 | 201 | 202 | 203 | 202 | 201 | 200 | 199 | 30 |
| 35 | 147 | 164 | 177 | 187 | 194 | 200 | 203 | 205 | 206 | 205 | 203 | 203 | 202 | 35 |
| 40 | 148 | 165 | 179 | 188 | 196 | 202 | 205 | 207 | 208 | 207 | 206 | 205 | 204 | 40 |
| 45 | 150 | 167 | 180 | 190 | 198 | 204 | 207 | 209 | 210 | 209 | 208 | 207 | 206 | 45 |
| 50 | 151 | 168 | 182 | 192 | 200 | 206 | 209 | 211 | 213 | 212 | 210 | 210 | 209 | 50 |
| 55 | 152 | 170 | 183 | 194 | 202 | 208 | 211 | 213 | 215 | 214 | 213 | 212 | 211 | 55 |
| 60 | 154 | 172 | 186 | 196 | 204 | 210 | 213 | 216 | 217 | 217 | 215 | 214 | 214 | 60 |
| 65 | 155 | 174 | 188 | 198 | 207 | 213 | 216 | 218 | 220 | 219 | 218 | 218 | 217 | 65 |
| 70 | 157 | 176 | 190 | 201 | 210 | 216 | 219 | 221 | 223 | 222 | 221 | 220 | 220 | 70 |
| 75 | 159 | 178 | 193 | 204 | 213 | 219 | 222 | 224 | 226 | 225 | 224 | 224 | 223 | 75 |
| 80 | 162 | 181 | 196 | 207 | 216 | 222 | 225 | 227 | 229 | 228 | 227 | 227 | 226 | 80 |
| 85 | 165 | 185 | 201 | 212 | 220 | 227 | 230 | 232 | 234 | 233 | 232 | 232 | 231 | 85 |
| 90 | 169 | 190 | 206 | 217 | 226 | 232 | 235 | 238 | 240 | 239 | 238 | 238 | 237 | 90 |
| 95 | 174 | 197 | 214 | 225 | 235 | 241 | 245 | 247 | 248 | 247 | 246 | 246 | 246 | 95 |
Table B.18. NWEA Map Scores by Grade Level 2026 Language Usage Norms – Spring Test for Schools (2025-2026) – Achievement Percentiles – (Language Usage, Spring, School)
| Pct | K | 1 | 2 | 3 | 4 | 5 | 6 | 7 | 8 | 9 | 10 | 11 | 12 | Pct |
|---|---|---|---|---|---|---|---|---|---|---|---|---|---|---|
| 5 | 147 | 160 | 171 | 181 | 188 | 194 | 197 | 200 | 201 | 199 | 198 | 197 | 195 | 5 |
| 10 | 148 | 162 | 174 | 183 | 191 | 197 | 200 | 203 | 204 | 202 | 201 | 200 | 199 | 10 |
| 15 | 149 | 163 | 175 | 184 | 193 | 198 | 202 | 205 | 206 | 204 | 204 | 203 | 202 | 15 |
| 20 | 150 | 164 | 177 | 186 | 194 | 200 | 203 | 206 | 208 | 206 | 206 | 205 | 204 | 20 |
| 25 | 151 | 165 | 178 | 187 | 195 | 201 | 204 | 207 | 209 | 207 | 207 | 206 | 206 | 25 |
| 30 | 152 | 166 | 179 | 188 | 196 | 202 | 205 | 209 | 210 | 209 | 208 | 208 | 207 | 30 |
| 35 | 152 | 166 | 180 | 189 | 197 | 203 | 206 | 210 | 211 | 210 | 210 | 209 | 209 | 35 |
| 40 | 153 | 167 | 181 | 190 | 198 | 204 | 208 | 211 | 213 | 212 | 212 | 211 | 210 | 40 |
| 45 | 153 | 168 | 182 | 191 | 199 | 205 | 209 | 212 | 214 | 213 | 213 | 212 | 212 | 45 |
| 50 | 154 | 169 | 183 | 192 | 200 | 206 | 210 | 214 | 215 | 214 | 214 | 214 | 213 | 50 |
| 55 | 155 | 170 | 184 | 193 | 201 | 208 | 211 | 215 | 217 | 216 | 216 | 215 | 215 | 55 |
| 60 | 155 | 171 | 185 | 194 | 202 | 209 | 212 | 217 | 218 | 217 | 217 | 216 | 216 | 60 |
| 65 | 156 | 172 | 186 | 196 | 204 | 210 | 214 | 218 | 220 | 219 | 219 | 218 | 218 | 65 |
| 70 | 157 | 172 | 188 | 197 | 205 | 212 | 215 | 220 | 221 | 220 | 220 | 220 | 219 | 70 |
| 75 | 158 | 173 | 189 | 198 | 207 | 213 | 217 | 221 | 223 | 222 | 222 | 222 | 222 | 75 |
| 80 | 160 | 175 | 191 | 200 | 209 | 216 | 219 | 223 | 225 | 224 | 224 | 224 | 224 | 80 |
| 85 | 162 | 177 | 194 | 203 | 213 | 219 | 222 | 226 | 228 | 227 | 227 | 227 | 227 | 85 |
| 90 | 165 | 180 | 198 | 207 | 218 | 224 | 227 | 231 | 233 | 232 | 232 | 232 | 232 | 90 |
| 95 | 170 | 185 | 205 | 212 | 224 | 230 | 233 | 237 | 240 | 238 | 239 | 238 | 239 | 95 |
Table B.19. NWEA Map Scores by Grade Level 2026 Science Norms – Fall Test for Students (2025-2026) – Achievement Percentiles – (Science, Fall, Student)
| Pct | K | 1 | 2 | 3 | 4 | 5 | 6 | 7 | 8 | 9 | 10 | 11 | 12 | Pct |
|---|---|---|---|---|---|---|---|---|---|---|---|---|---|---|
| 5 | 126 | 137 | 145 | 154 | 163 | 170 | 173 | 177 | 177 | 177 | 177 | 176 | 175 | 5 |
| 10 | 128 | 141 | 150 | 159 | 169 | 175 | 180 | 183 | 183 | 184 | 184 | 183 | 182 | 10 |
| 15 | 131 | 144 | 153 | 162 | 172 | 178 | 183 | 186 | 187 | 188 | 188 | 187 | 187 | 15 |
| 20 | 133 | 146 | 156 | 165 | 175 | 181 | 186 | 189 | 190 | 191 | 191 | 191 | 190 | 20 |
| 25 | 134 | 147 | 158 | 167 | 177 | 184 | 188 | 192 | 193 | 194 | 194 | 194 | 194 | 25 |
| 30 | 136 | 149 | 160 | 169 | 180 | 186 | 191 | 194 | 195 | 197 | 197 | 197 | 197 | 30 |
| 35 | 137 | 151 | 161 | 172 | 182 | 188 | 193 | 196 | 198 | 199 | 199 | 199 | 199 | 35 |
| 40 | 138 | 152 | 163 | 174 | 184 | 190 | 195 | 198 | 200 | 201 | 202 | 202 | 202 | 40 |
| 45 | 139 | 153 | 165 | 175 | 186 | 192 | 196 | 200 | 201 | 203 | 203 | 203 | 204 | 45 |
| 50 | 140 | 155 | 166 | 177 | 188 | 194 | 198 | 202 | 203 | 205 | 205 | 206 | 206 | 50 |
| 55 | 141 | 156 | 168 | 179 | 190 | 195 | 200 | 204 | 205 | 207 | 207 | 208 | 208 | 55 |
| 60 | 143 | 158 | 169 | 181 | 192 | 197 | 202 | 206 | 207 | 210 | 210 | 211 | 212 | 60 |
| 65 | 144 | 159 | 171 | 183 | 194 | 199 | 204 | 208 | 210 | 212 | 212 | 214 | 214 | 65 |
| 70 | 145 | 161 | 173 | 185 | 196 | 201 | 206 | 211 | 212 | 215 | 215 | 216 | 216 | 70 |
| 75 | 146 | 163 | 175 | 187 | 199 | 203 | 209 | 213 | 215 | 217 | 218 | 219 | 219 | 75 |
| 80 | 148 | 165 | 177 | 190 | 202 | 206 | 212 | 217 | 218 | 221 | 222 | 223 | 223 | 80 |
| 85 | 150 | 168 | 180 | 193 | 206 | 210 | 216 | 220 | 222 | 225 | 226 | 227 | 227 | 85 |
| 90 | 153 | 172 | 184 | 197 | 210 | 214 | 220 | 224 | 226 | 230 | 231 | 232 | 233 | 90 |
| 95 | 157 | 177 | 190 | 203 | 216 | 220 | 226 | 230 | 232 | 236 | 238 | 239 | 239 | 95 |
Table B.20. NWEA Map Scores by Grade Level 2026 Science Norms – Fall Test for Schools (2025-2026) – Achievement Percentiles – (Science, Fall, School)
| Pct | K | 1 | 2 | 3 | 4 | 5 | 6 | 7 | 8 | 9 | 10 | 11 | 12 | Pct |
|---|---|---|---|---|---|---|---|---|---|---|---|---|---|---|
| 5 | 134 | 149 | 160 | 171 | 180 | 187 | 191 | 194 | 195 | 194 | 194 | 193 | 192 | 5 |
| 10 | 136 | 150 | 162 | 173 | 182 | 189 | 194 | 197 | 198 | 197 | 197 | 197 | 195 | 10 |
| 15 | 137 | 151 | 163 | 174 | 183 | 190 | 195 | 199 | 200 | 199 | 199 | 199 | 198 | 15 |
| 20 | 138 | 152 | 164 | 175 | 184 | 192 | 197 | 200 | 201 | 201 | 201 | 201 | 200 | 20 |
| 25 | 139 | 153 | 165 | 176 | 185 | 193 | 198 | 201 | 202 | 203 | 203 | 203 | 202 | 25 |
| 30 | 140 | 154 | 167 | 177 | 186 | 194 | 199 | 202 | 203 | 204 | 205 | 205 | 203 | 30 |
| 35 | 141 | 155 | 167 | 179 | 187 | 195 | 200 | 203 | 204 | 205 | 206 | 206 | 205 | 35 |
| 40 | 142 | 156 | 168 | 180 | 188 | 197 | 201 | 204 | 205 | 206 | 207 | 207 | 206 | 40 |
| 45 | 143 | 157 | 169 | 181 | 190 | 198 | 202 | 206 | 207 | 208 | 208 | 208 | 207 | 45 |
| 50 | 144 | 158 | 170 | 182 | 191 | 199 | 203 | 207 | 208 | 209 | 210 | 210 | 209 | 50 |
| 55 | 144 | 158 | 171 | 183 | 192 | 200 | 204 | 208 | 209 | 210 | 211 | 211 | 210 | 55 |
| 60 | 145 | 159 | 172 | 184 | 193 | 201 | 205 | 209 | 210 | 212 | 212 | 213 | 212 | 60 |
| 65 | 146 | 160 | 173 | 185 | 195 | 202 | 206 | 210 | 212 | 213 | 214 | 214 | 213 | 65 |
| 70 | 147 | 161 | 175 | 187 | 196 | 203 | 207 | 212 | 213 | 215 | 216 | 216 | 215 | 70 |
| 75 | 148 | 162 | 176 | 188 | 197 | 204 | 209 | 213 | 215 | 217 | 217 | 218 | 217 | 75 |
| 80 | 149 | 163 | 177 | 190 | 199 | 206 | 210 | 215 | 216 | 218 | 219 | 219 | 218 | 80 |
| 85 | 150 | 164 | 179 | 192 | 202 | 209 | 213 | 218 | 219 | 222 | 222 | 223 | 222 | 85 |
| 90 | 152 | 166 | 181 | 195 | 205 | 212 | 216 | 221 | 223 | 226 | 226 | 227 | 226 | 90 |
| 95 | 154 | 168 | 184 | 199 | 209 | 216 | 220 | 225 | 227 | 230 | 231 | 232 | 231 | 95 |
Table B.21. NWEA Map Scores by Grade Level 2026 Science Norms – Winter Test for Students (2025-2026) – Achievement Percentiles – (Science, Winter, Student)
| Pct | K | 1 | 2 | 3 | 4 | 5 | 6 | 7 | 8 | 9 | 10 | 11 | 12 | Pct |
|---|---|---|---|---|---|---|---|---|---|---|---|---|---|---|
| 5 | 130 | 142 | 152 | 161 | 169 | 175 | 179 | 181 | 183 | 181 | 181 | 180 | 178 | 5 |
| 10 | 134 | 146 | 157 | 167 | 175 | 182 | 185 | 187 | 189 | 188 | 187 | 187 | 185 | 10 |
| 15 | 137 | 150 | 161 | 171 | 179 | 186 | 189 | 192 | 194 | 193 | 192 | 192 | 191 | 15 |
| 20 | 139 | 152 | 164 | 174 | 183 | 189 | 193 | 196 | 198 | 197 | 197 | 196 | 194 | 20 |
| 25 | 141 | 154 | 166 | 176 | 185 | 192 | 196 | 198 | 200 | 200 | 199 | 199 | 197 | 25 |
| 30 | 142 | 155 | 169 | 179 | 188 | 194 | 198 | 200 | 203 | 202 | 202 | 201 | 200 | 30 |
| 35 | 144 | 157 | 170 | 181 | 190 | 196 | 200 | 202 | 205 | 205 | 205 | 204 | 203 | 35 |
| 40 | 145 | 158 | 172 | 183 | 192 | 198 | 202 | 204 | 207 | 207 | 207 | 206 | 205 | 40 |
| 45 | 146 | 159 | 173 | 185 | 194 | 200 | 204 | 206 | 209 | 209 | 209 | 209 | 208 | 45 |
| 50 | 147 | 160 | 174 | 187 | 195 | 202 | 206 | 208 | 211 | 211 | 211 | 211 | 210 | 50 |
| 55 | 149 | 162 | 176 | 189 | 197 | 204 | 208 | 210 | 213 | 214 | 214 | 214 | 213 | 55 |
| 60 | 150 | 163 | 178 | 191 | 200 | 206 | 210 | 213 | 215 | 216 | 216 | 216 | 215 | 60 |
| 65 | 151 | 164 | 179 | 193 | 202 | 208 | 212 | 215 | 217 | 218 | 218 | 218 | 217 | 65 |
| 70 | 152 | 166 | 181 | 195 | 205 | 210 | 214 | 217 | 220 | 221 | 221 | 221 | 220 | 70 |
| 75 | 154 | 167 | 183 | 198 | 208 | 213 | 217 | 220 | 223 | 224 | 224 | 224 | 223 | 75 |
| 80 | 156 | 170 | 185 | 201 | 211 | 216 | 220 | 223 | 226 | 227 | 227 | 227 | 226 | 80 |
| 85 | 158 | 172 | 188 | 205 | 214 | 219 | 223 | 227 | 230 | 231 | 231 | 231 | 230 | 85 |
| 90 | 161 | 175 | 192 | 210 | 219 | 224 | 229 | 232 | 235 | 236 | 237 | 237 | 236 | 90 |
| 95 | 165 | 179 | 197 | 217 | 226 | 231 | 236 | 239 | 242 | 244 | 244 | 244 | 243 | 95 |
Table B.22. NWEA Map Scores by Grade Level 2026 Science Norms – Winter Test for Schools (2025-2026) – Achievement Percentiles – (Science, Winter, School)
| Pct | K | 1 | 2 | 3 | 4 | 5 | 6 | 7 | 8 | 9 | 10 | 11 | 12 | Pct |
|---|---|---|---|---|---|---|---|---|---|---|---|---|---|---|
| 5 | 141 | 155 | 166 | 176 | 184 | 191 | 194 | 196 | 198 | 196 | 195 | 195 | 193 | 5 |
| 10 | 142 | 156 | 167 | 178 | 186 | 193 | 196 | 199 | 201 | 199 | 199 | 198 | 197 | 10 |
| 15 | 143 | 157 | 169 | 179 | 188 | 195 | 198 | 201 | 203 | 202 | 201 | 201 | 199 | 15 |
| 20 | 144 | 158 | 170 | 180 | 189 | 197 | 200 | 203 | 205 | 204 | 203 | 203 | 201 | 20 |
| 25 | 145 | 159 | 171 | 181 | 191 | 198 | 201 | 204 | 207 | 206 | 205 | 205 | 203 | 25 |
| 30 | 145 | 160 | 172 | 183 | 192 | 199 | 203 | 205 | 208 | 207 | 207 | 206 | 205 | 30 |
| 35 | 146 | 161 | 173 | 184 | 193 | 200 | 204 | 207 | 209 | 209 | 208 | 208 | 206 | 35 |
| 40 | 147 | 162 | 174 | 186 | 194 | 201 | 205 | 208 | 211 | 210 | 209 | 209 | 208 | 40 |
| 45 | 148 | 163 | 175 | 187 | 195 | 202 | 207 | 209 | 212 | 211 | 211 | 211 | 209 | 45 |
| 50 | 148 | 164 | 176 | 188 | 196 | 204 | 208 | 210 | 214 | 213 | 212 | 212 | 210 | 50 |
| 55 | 149 | 165 | 177 | 189 | 198 | 205 | 209 | 212 | 215 | 214 | 214 | 214 | 213 | 55 |
| 60 | 150 | 166 | 178 | 190 | 200 | 207 | 211 | 214 | 216 | 216 | 216 | 216 | 214 | 60 |
| 65 | 151 | 166 | 179 | 192 | 201 | 208 | 213 | 215 | 218 | 218 | 218 | 218 | 217 | 65 |
| 70 | 152 | 168 | 181 | 193 | 203 | 209 | 214 | 216 | 220 | 220 | 220 | 220 | 219 | 70 |
| 75 | 153 | 169 | 183 | 195 | 205 | 211 | 216 | 219 | 222 | 222 | 222 | 222 | 221 | 75 |
| 80 | 154 | 170 | 184 | 197 | 206 | 213 | 218 | 221 | 224 | 224 | 224 | 224 | 223 | 80 |
| 85 | 155 | 172 | 186 | 199 | 209 | 216 | 221 | 224 | 227 | 227 | 227 | 227 | 227 | 85 |
| 90 | 157 | 174 | 188 | 202 | 213 | 220 | 225 | 227 | 230 | 231 | 231 | 231 | 231 | 90 |
| 95 | 159 | 176 | 191 | 205 | 218 | 224 | 230 | 232 | 235 | 236 | 236 | 237 | 236 | 95 |
Table B.23. NWEA Map Scores by Grade Level 2026 Science Norms – Spring Test for Students (2025-2026) – Achievement Percentiles – (Science, Spring, Student)
| Pct | K | 1 | 2 | 3 | 4 | 5 | 6 | 7 | 8 | 9 | 10 | 11 | 12 | Pct |
|---|---|---|---|---|---|---|---|---|---|---|---|---|---|---|
| 5 | 134 | 147 | 157 | 166 | 174 | 180 | 183 | 185 | 187 | 184 | 182 | 181 | 178 | 5 |
| 10 | 139 | 153 | 163 | 173 | 181 | 187 | 190 | 192 | 194 | 190 | 189 | 187 | 185 | 10 |
| 15 | 143 | 157 | 168 | 178 | 185 | 191 | 194 | 196 | 198 | 195 | 193 | 192 | 190 | 15 |
| 20 | 146 | 159 | 171 | 181 | 189 | 194 | 198 | 200 | 202 | 199 | 197 | 196 | 194 | 20 |
| 25 | 148 | 161 | 173 | 184 | 192 | 196 | 200 | 203 | 205 | 202 | 201 | 199 | 197 | 25 |
| 30 | 149 | 163 | 175 | 186 | 194 | 198 | 203 | 205 | 207 | 205 | 204 | 202 | 201 | 30 |
| 35 | 151 | 164 | 177 | 188 | 196 | 201 | 205 | 208 | 209 | 208 | 207 | 205 | 204 | 35 |
| 40 | 152 | 166 | 179 | 190 | 198 | 203 | 207 | 210 | 212 | 210 | 209 | 208 | 207 | 40 |
| 45 | 154 | 168 | 180 | 192 | 200 | 204 | 209 | 212 | 214 | 213 | 212 | 210 | 209 | 45 |
| 50 | 156 | 169 | 182 | 194 | 202 | 206 | 212 | 214 | 216 | 215 | 214 | 213 | 212 | 50 |
| 55 | 157 | 171 | 184 | 196 | 204 | 208 | 214 | 217 | 218 | 218 | 217 | 215 | 214 | 55 |
| 60 | 159 | 173 | 186 | 198 | 206 | 210 | 216 | 219 | 221 | 220 | 219 | 218 | 217 | 60 |
| 65 | 160 | 175 | 188 | 201 | 208 | 212 | 218 | 221 | 223 | 223 | 222 | 221 | 220 | 65 |
| 70 | 162 | 177 | 191 | 203 | 210 | 215 | 220 | 224 | 226 | 226 | 224 | 223 | 222 | 70 |
| 75 | 164 | 179 | 193 | 207 | 213 | 218 | 223 | 227 | 229 | 228 | 228 | 227 | 226 | 75 |
| 80 | 167 | 181 | 197 | 210 | 216 | 221 | 226 | 230 | 232 | 231 | 231 | 230 | 229 | 80 |
| 85 | 169 | 184 | 200 | 214 | 220 | 224 | 229 | 233 | 235 | 235 | 234 | 234 | 233 | 85 |
| 90 | 173 | 188 | 204 | 220 | 224 | 228 | 234 | 238 | 240 | 240 | 239 | 239 | 238 | 90 |
| 95 | 179 | 193 | 210 | 226 | 229 | 234 | 240 | 243 | 245 | 245 | 245 | 244 | 243 | 95 |
Table B.24. NWEA Map Scores by Grade Level 2026 Science Norms – Spring Test for Schools (2025-2026) – Achievement Percentiles – (Science, Spring, Schools)
| Pct | K | 1 | 2 | 3 | 4 | 5 | 6 | 7 | 8 | 9 | 10 | 11 | 12 | Pct |
|---|---|---|---|---|---|---|---|---|---|---|---|---|---|---|
| 5 | 146 | 159 | 170 | 180 | 188 | 194 | 197 | 200 | 201 | 198 | 198 | 196 | 194 | 5 |
| 10 | 148 | 161 | 173 | 183 | 191 | 198 | 201 | 204 | 205 | 202 | 201 | 201 | 199 | 10 |
| 15 | 149 | 162 | 175 | 185 | 193 | 200 | 202 | 206 | 207 | 204 | 203 | 203 | 201 | 15 |
| 20 | 150 | 164 | 176 | 186 | 194 | 201 | 204 | 207 | 209 | 206 | 205 | 205 | 204 | 20 |
| 25 | 151 | 165 | 177 | 187 | 195 | 202 | 205 | 208 | 210 | 208 | 207 | 207 | 205 | 25 |
| 30 | 152 | 166 | 178 | 188 | 196 | 203 | 206 | 209 | 211 | 209 | 209 | 208 | 207 | 30 |
| 35 | 153 | 167 | 179 | 189 | 197 | 204 | 207 | 210 | 212 | 211 | 210 | 210 | 209 | 35 |
| 40 | 154 | 168 | 181 | 190 | 198 | 205 | 208 | 212 | 213 | 212 | 211 | 211 | 210 | 40 |
| 45 | 155 | 169 | 181 | 191 | 200 | 206 | 209 | 213 | 214 | 213 | 212 | 212 | 211 | 45 |
| 50 | 155 | 169 | 182 | 192 | 201 | 208 | 210 | 214 | 216 | 215 | 214 | 214 | 213 | 50 |
| 55 | 156 | 170 | 183 | 193 | 202 | 209 | 212 | 216 | 217 | 216 | 216 | 215 | 214 | 55 |
| 60 | 157 | 171 | 184 | 194 | 203 | 210 | 213 | 217 | 219 | 218 | 217 | 217 | 216 | 60 |
| 65 | 158 | 172 | 185 | 195 | 204 | 211 | 215 | 218 | 221 | 220 | 219 | 219 | 218 | 65 |
| 70 | 159 | 173 | 186 | 196 | 206 | 212 | 216 | 221 | 222 | 221 | 221 | 221 | 220 | 70 |
| 75 | 160 | 174 | 188 | 198 | 207 | 214 | 218 | 222 | 224 | 223 | 223 | 222 | 222 | 75 |
| 80 | 161 | 176 | 190 | 201 | 210 | 217 | 220 | 225 | 227 | 226 | 225 | 225 | 224 | 80 |
| 85 | 163 | 178 | 193 | 204 | 214 | 220 | 223 | 228 | 230 | 229 | 229 | 229 | 228 | 85 |
| 90 | 166 | 182 | 197 | 209 | 219 | 225 | 228 | 233 | 235 | 234 | 234 | 234 | 233 | 90 |
| 95 | 169 | 185 | 203 | 214 | 225 | 231 | 234 | 239 | 242 | 241 | 241 | 241 | 240 | 95 |
How to Understand NWEA MAP Scores in 2025–2026.
MAP Growth scores can feel confusing at first. It’s not just you. Most parents open a MAP report and immediately think, “Is this good?” or “Is my child behind?” The report often shows a number (the RIT score), a percentile, and a few charts, but it does not look like traditional grades. There is no A, B, or 90%. There is no simple “pass or fail.”
Here’s the good news. MAP scores are actually very logical once you know what the test measures and how the score is built. And once you understand the basics, the report becomes much more useful. It can help you see where your child is right now, how they are growing during the school year, and what skills they should work on next.
This long guide is written for parents. It uses short sentences when things should be simple. It also uses longer sentences when you need the full picture. By the end, you should feel calm, clear, and confident when reading your child’s MAP report for 2025 and 2026.
What Are NWEA MAP Scores?
NWEA MAP Growth is a computer-based assessment used in many schools across the United States. MAP stands for Measures of Academic Progress. The test is designed to measure academic achievement and growth over time, which is why many schools give it more than once per year.
Most students take MAP Growth in three testing windows: Fall, Winter, and Spring. Some schools test twice a year instead. Either way, the idea is the same. MAP is not meant to be a single moment that defines a child. It is meant to track progress across the year and across multiple years.
MAP Growth is most commonly used for Math and Reading. Many districts also use it for Language Usage. Some use it for Science in certain grades. Not every school uses every subject, so your child’s report may look different from a friend’s report in another district.
What MAP Growth Is Trying to Tell You (Two Big Parent Questions)
Parents usually want a simple answer. They want to know if the score is “good” or “bad.” But MAP is built around growth and learning level, not a single grade-level percentage. MAP is most helpful when you use it to answer two questions:
- Where is my child right now in their learning?
- How much are they growing compared to what is typical?
That’s the heart of MAP. It is not about labeling your child. It is about understanding learning level and tracking change. Some children start higher. Some children start lower. What matters most is steady growth and a clear plan for next steps.
Why MAP Scores Do Not Look Like Traditional Test Scores
Many classroom tests are fixed-level tests. That means every student gets a similar set of questions for their grade, and the score is based on percent correct. A student might score 75% because they answered 30 out of 40 questions correctly. This can be easy to understand, but it has a limitation. It cannot measure students far above or far below grade level very well.
MAP Growth is different because it is computer-adaptive. The test changes as your child answers. If your child answers correctly, the next question often becomes a bit harder. If your child answers incorrectly, the next question often becomes a bit easier. Over many questions, the test finds the level where your child is working best. This is why some students feel the test “gets harder.” If they are doing well, it should get harder. That is how the test finds their true learning level.
Because it is adaptive, MAP does not report percent correct. Instead, it reports a learning-level score. That score is called the RIT score.
How the MAP Test Works (Simple Explanation for Parents)
Imagine a ladder. The bottom rungs represent easier skills. The higher rungs represent harder skills. MAP is trying to find the rung where your child is working. Not too easy. Not too hard. Just right.
That means two children in the same grade can get different questions. And that’s okay. The goal is not fairness through identical questions. The goal is accuracy. MAP aims to measure each child’s level as precisely as possible.
This also explains something parents notice. A strong student may come home saying, “It was really hard.” That may actually be a good sign, because the test kept pushing them upward into more challenging questions. A struggling student may say, “It was easier than I expected,” because the test adjusted downward to find a better fit.
What Is a RIT Score?
RIT is the main MAP score. RIT stands for Rasch Unit. It is a measurement scale that places academic skills on a consistent ladder from kindergarten through high school. A RIT score is not a grade level. It is not a percentage. It is not a “score out of 100.” It is a learning-level number.
A helpful parent-friendly way to think about RIT is this: it represents the difficulty level of questions your child is ready to work with right now. Another way to say it is that a RIT score is your child’s current learning level in that subject.
Because the RIT scale is consistent across grades, it is useful for tracking growth. A child’s RIT score should generally rise over time as they learn.
What RIT Scores Mean (And What They Do Not Mean)
RIT scores do mean:
- Where your child is on a continuous learning scale right now
- A way to track progress across Fall, Winter, and Spring
- A way for teachers to group students and plan instruction
RIT scores do not mean:
- A percent correct
- A letter grade like A, B, or C
- A promise about future performance
- A diagnosis by themselves
A RIT score becomes most powerful when you compare it to your child’s previous scores and when you use the skill breakdown section of the report to decide what to practice next.
Why the Same Student’s RIT Score Should Rise Over Time
In general, RIT scores should increase as students learn. Most students will show growth from Fall to Winter and from Winter to Spring. However, growth is not identical at every age. Younger students often gain more points because foundational skills develop rapidly. Older students often gain fewer points because learning becomes deeper and more specialized, and MAP measures broad skills rather than specific course content.
It is normal for a kindergarten or first-grade student to show larger jumps. It is also normal for a high school student to show smaller increases and sometimes plateau. A plateau does not always mean “no learning.” It can mean the student is already strong in the broad skills MAP measures, or that the test is less sensitive to the specialized learning happening in advanced courses.
Understanding Percentiles on MAP Reports
The percentile is the “context number.” It helps you understand how your child compares to other students nationally in the same grade and season. Percentiles can feel emotional. Parents see a number and instantly worry. Try to keep it simple.
A percentile answers this question: out of 100 students nationwide in the same grade and season, about how many did your child score higher than?
- 50th percentile means your child is around the national average
- 75th percentile means your child scored higher than about 75% of peers
- 25th percentile means your child scored higher than about 25% of peers
A key parent insight: percentiles are relative. If your child’s percentile stays about the same across the year, that can still represent strong progress, because their RIT score should still rise. Staying at the 60th percentile year after year often means your child is learning at about the same pace as other similarly ranked peers. That is normal.
Standard Error and Score Ranges (Why Some Reports Show “Plus or Minus”)
Many MAP reports show a RIT score along with a small range, sometimes written like a plus/minus band. This is often called a standard error or confidence range. It exists because no test measures learning perfectly. Day-to-day factors like stress, fatigue, distractions, or test anxiety can affect performance.
Parents should treat small changes inside that typical range as normal. Don’t panic over tiny differences. Larger changes across multiple testing windows are more meaningful, especially when they match what you see in classwork and teacher feedback.
Achievement Norms vs Growth Norms (The Two “Norm” Ideas Parents Hear About)
Parents often hear the word “norms” and assume it means a passing score. In MAP Growth, norms are not passing cutoffs. Norms are reference points based on large groups of students.
There are two main norm ideas:
- Achievement norms describe where a child is right now compared to peers (this connects to percentiles).
- Growth norms describe how much growth is typical over time for students who start at a similar score.
A parent-friendly way to remember it is this: achievement norms are “where your child is,” and growth norms are “how much your child is moving.”
Why NWEA Updated the MAP Growth Norms in 2025 (What It Means for 2025–2026)
In 2025, NWEA updated the official MAP Growth achievement norms to reflect more recent national student performance data. The RIT scale itself did not change. The meaning of a RIT score did not change. What changed is the national comparison group used to calculate percentiles.
That means your child could earn a similar RIT score as in previous years, but the percentile might look slightly different than older reports. This is not a mistake. It is simply a newer national benchmark.
Norm updates typically happen every several years. They do not happen every year. The 2025 update replaces the prior norms and is designed to provide a more accurate and current benchmark of student achievement across the United States.
The sample described for the update is very large. It includes 116 million scores from 13.8 million students across about 30,000 schools, spanning six testing terms from fall 2022 through spring 2024. In other words, the norms are built to broadly reflect the U.S. student population.
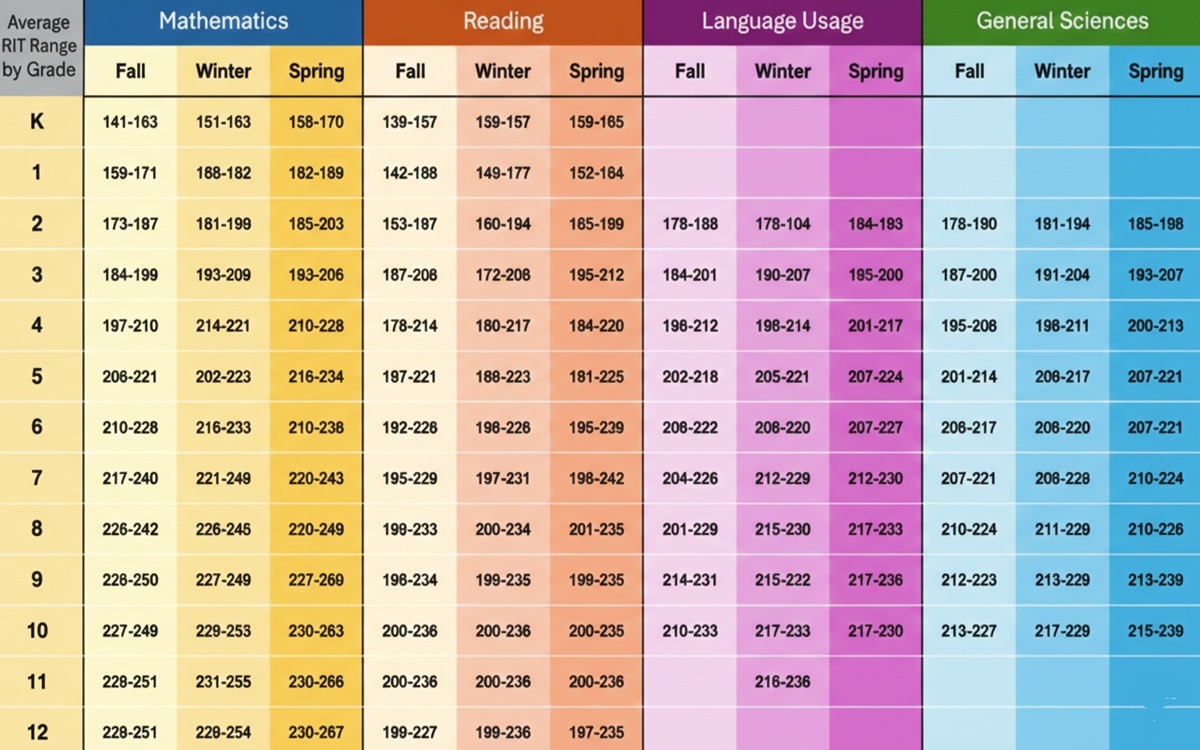
NWEA Map Scores by Grade Level 2026 – Map Score Chart – Average.
Need a quick understanding of how your child is doing compared to the national average? This Map Score Chart shows the national average range of what is considered a ‘Good Map Score’ for each Grade Level at the Fall, Winter and Spring Map Test, in Math, Reading, Language Usage, and General Sciences.
Seasonal Timing: Why Fall, Winter, and Spring Norms Are Not the Same
MAP norms are tied to typical points in the school year. This matters because a fall score is not the same as a spring score, even if the number is similar, because students have had different amounts of instruction.
The norms are conditioned to specific instructional weeks:
- Fall norms are based on assessments around the 4th week of instruction
- Winter norms are based on assessments around the 20th week of instruction
- Spring norms are based on assessments around the 32nd week of instruction
This conditioning helps ensure students are compared fairly at similar points in the academic year. It also means parents should be careful when comparing results if their school’s testing date was much earlier or later than typical for that season.
Student vs School Percentiles (This Is the Part That Confuses Many Parents)
When you look at the official norms tables, you may notice two types of percentile tables:
- Student Achievement Percentiles
- School Achievement Percentiles
They sound similar, but they are used for different things. This is the simplest rule for parents:
If you are trying to understand your child’s performance, always use the Student Achievement Percentiles.
Student Achievement Percentiles (The One Parents Should Use)
Student percentiles compare an individual student’s RIT score to other students nationwide in the same grade and season. This is the percentile you typically see on your child’s MAP report.
Example:
- If your child is at the 60th percentile, they scored higher than about 60% of students nationally in the same grade and season.
- If your child is at the 25th percentile, they scored higher than about 25% of students, meaning about 75% scored higher.
A quick interpretation guide:
- 90th percentile or higher = very high achievement
- 75th percentile = above average
- 50th percentile = around the national average
- 25th percentile = below average
- 10th percentile or lower = significantly below average
School Achievement Percentiles (Not Intended for Individual Students)
School percentiles measure something different. They compare the average score of an entire school to other schools across the country. This is used by districts, administrators, and researchers to evaluate school-wide performance and trends.
For example, if a school is at the 60th percentile, it means the school’s average student score is higher than about 60% of schools nationally. This does not mean your child is at the 60th percentile. It is about the school average, not individual performance.
So if you see “School” in the table title, do not use that table to interpret your child’s MAP score.
Which Charts Should Parents Use: Median Range vs Mean Score?
Many parent-focused MAP pages include charts labeled “Median Range” and charts labeled “Mean Score.” Both are ways to describe national norms, but they are slightly different.
The median is the middle score. Half of students score above it, and half score below it. The mean is the average score. In most cases, both will give you a similar general understanding of “typical” performance, but they are not always identical.
If you want something quick and simple, use the median range chart as a fast reference point. If you want the traditional “average,” look at the mean score chart. Either way, remember the best MAP interpretation comes from looking at your child’s growth across seasons and the skill breakdown areas on the report.
What Is a “Good” MAP Score?
Parents want a clear target. That’s understandable. But MAP is not designed around one perfect score for every child. A “good” MAP score depends on grade, subject, season, and where the child started.
A good MAP score is best defined in three ways:
- It falls in a healthy range compared to grade-level norms for that season.
- It shows expected growth from the child’s previous score.
- It aligns with classroom performance and teacher observations.
A child can score below the national average but still be doing well if they are growing faster than typical. A child can also score above average but show weak growth if they are not progressing as expected. This is why MAP is a growth tool, not just a ranking tool.
MAP Growth Projections: What “Projected Scores” Mean
Some MAP reports include projected scores for the next season. These projections are based on growth norms. They are not guarantees. They are statistical expectations based on patterns across many students.
If your child scores above the projection, it may suggest they grew faster than typical. If your child scores below the projection, it may suggest slower-than-typical growth, or it could simply reflect an off day, illness, stress, or other factors that affected the test.
Parents should use projections as conversation starters, not labels. The best question is, “What skills do we focus on next?” not “Why didn’t you hit the projection?”
How to Read a MAP Score Report Step-by-Step
When you receive a MAP report, follow these steps in order. This simple process prevents confusion and helps you focus on what matters most.
Step 1: Identify the subject and season
First, confirm the subject (Math, Reading, Language Usage, or Science) and the season (Fall, Winter, or Spring). Scores should be compared within the same subject and across seasons for growth.
Step 2: Find the RIT score
The RIT score is the main learning-level number. Write it down. Then compare it to the previous season’s RIT score in the same subject.
Step 3: Look at the student percentile
The student percentile gives national context. It shows how your child compares to peers nationwide in the same grade and season. Use the student percentile, not school percentile tables.
Step 4: Check growth from the last testing window
Look at the change in RIT score from the last testing window. Then compare it to the growth expectation or projected growth if your report includes it.
Step 5: Review the goal or domain breakdown
This is often the most useful part of the report. It breaks the subject into skill areas. Two children with the same overall score can have different strengths and needs. The goal breakdown helps your teacher plan instruction and helps you understand what to practice at home.
Step 6: Turn the results into a simple plan
A parent plan should be small and realistic. Pick one or two skills to strengthen, and one strength to maintain. Then build a weekly routine. Consistency matters more than intensity.
Common Parent Mistakes With MAP Scores (And How to Avoid Them)
Mistake 1: Treating MAP like a grade
MAP is not a percent-correct test. A score is not “good” or “bad” by itself. Growth and skill needs matter.
Mistake 2: Comparing the wrong seasons
Fall, Winter, and Spring expectations are different. Always compare growth across seasons and use the correct norms for that season.
Mistake 3: Ignoring growth and focusing only on percentile
A stable percentile with a rising RIT score is still progress. Look at the trajectory over time.
Mistake 4: Overreacting to small drops
Small differences can be normal testing variability, especially if they fall within the confidence range. Look for patterns across multiple tests.
Mistake 5: Skipping the goal-area breakdown
The goal areas tell you what to work on next. They are usually more helpful than the overall score alone.
How Parents Can Help at Home Without “Teaching to the Test”
Parents often ask how to raise MAP scores. The best answer is not test tricks. It is skill growth. The most effective support is consistent practice in the underlying skills the test measures.
Simple ways to help:
- Read with your child and talk about what you read.
- Ask “why” questions and encourage evidence-based answers.
- Practice math thinking, not just math facts.
- Encourage writing and revising short paragraphs.
- Help your child sleep well and eat well before testing days.
MAP scores often rise naturally when students build stronger reading comprehension, stronger number sense, and stronger academic vocabulary.
For Parents
MAP Growth is a tool. It is not a label. It helps schools and families understand learning level and track growth over time. The most important things to look at are the RIT score trend across seasons, the student percentile (not school percentile tables), and the skill breakdown areas that show what to learn next.
If you ever feel unsure, bring the report to a parent-teacher conference and ask one simple question: “What does this score mean for what my child should work on next?” That question turns MAP data into an action plan.
– NWEA Map Scores by Grade Level 2026 – Data Checked and Updated March 2026.