
NWEA Map Test Scores by Grade Level Percentiles 2025-2026 PDF (Charts by Grade Level)
NWEA MAP Scores by Grade Level 2025-2026 – Percentiles.
Welcome! We have added all NWEA Map scores by grade 2026 (and 2025) with charts, percentiles and interpretation.
If you have been given NWEA Map scores for your child, but don’t know how to interpret them, then you are in the right place.
See which percentile your child’s score is, compared to nationwide Map scores for that grade.
The NWEA MAP test is an adaptive assessment for K-12 students that covers math, reading, language usage, and science. It is one of the most trusted and widely used assessments for primary and secondary educators.
MAP test scores help benchmark how far above or below grade level students are in specific sub-topics. Using these scores, educators can tailor curriculums and lessons to help students master subjects they may be struggling with.
Quick Links:
NWEA MAP scores by grade level 2024-2025 – Percentiles.
NWEA MAP scores by grade level 2024-2025 – Fall, Winter and Spring.
NWEA MAP scores by grade level 2024-2025
Below are the NWEA MAP scores percentile, and subject, for the following grade levels:
- Kindergarden Map Test Scores
- 1st Grade Map Test Scores
- 2nd Grade Map Test Scores
- 3rd Grade Map Test Scores
- 4th Grade Map Test Scores
- 5th Grade Map Test Scores
- 6th Grade Map Test Scores
- 7th Grade Map Test Scores
- 8th Grade Map Test Scores
- 9th Grade Map Test Scores
- 10th Grade Map Test Scores
- 11th Grade Map Test Scores
- 12th Grade Map Test Scores
Kindergarten Test MAP Scores
The tables below show the NWEA MAP scores for Kindergarten students in Math and Reading across different testing seasons.
Fall
The MAP Scores chart below shows Kindergarten MAP scores and percentiles for the Fall timeframe.
| Percentile | Math | Reading | Language |
|---|---|---|---|
| 1 – 9 | 111-123 | 108-120 | N/A |
| 10 – 19 | 124-129 | 121-126 | N/A |
| 20 – 29 | 129-133 | 126-130 | N/A |
| 30 – 39 | 133-136 | 130-133 | N/A |
| 40 – 49 | 136-139 | 134-136 | N/A |
| 50 – 59 | 140-142 | 137-139 | N/A |
| 60 – 69 | 143-146 | 140-143 | N/A |
| 70 – 79 | 146-150 | 143-147 | N/A |
| 80 – 89 | 150-155 | 147-152 | N/A |
| 90 – 99 | 156-169 | 152-165 | N/A |
Winter
The MAP Scores chart below shows Kindergarten MAP scores and percentiles for the Winter timeframe.
| Percentile | Math | Reading | Language |
|---|---|---|---|
| 1 – 9 | 122-134 | 119-130 | N/A |
| 10 – 19 | 135-140 | 131-136 | N/A |
| 20 – 29 | 140-144 | 136-140 | N/A |
| 30 – 39 | 144-147 | 140-143 | N/A |
| 40 – 49 | 147-150 | 143-146 | N/A |
| 50 – 59 | 150-153 | 146-149 | N/A |
| 60 – 69 | 153-156 | 149-152 | N/A |
| 70 – 79 | 156-160 | 152-156 | N/A |
| 80 – 89 | 160-165 | 156-161 | N/A |
| 90 – 99 | 165-178 | 161-174 | N/A |
Spring
The MAP Scores chart below shows Kindergarten MAP scores and percentiles for the Spring timeframe.
| Percentile | Math | Reading | Language |
|---|---|---|---|
| 1 – 9 | 129-141 | 125-137 | N/A |
| 10 – 19 | 142-147 | 138-143 | N/A |
| 20 – 29 | 147-150 | 143-146 | N/A |
| 30 – 39 | 151-154 | 147-150 | N/A |
| 40 – 49 | 154-157 | 150-153 | N/A |
| 50 – 59 | 157-160 | 153-156 | N/A |
| 60 – 69 | 160-163 | 156-159 | N/A |
| 70 – 79 | 163-167 | 159-163 | N/A |
| 80 – 89 | 167-172 | 163-168 | N/A |
| 90 – 99 | 173-185 | 169-181 | N/A |
1st Grade MAP Test Scores
The tables below show the NWEA MAP scores for 1st-grade students in Math and Reading across different testing seasons.
Fall
The MAP Scores chart below shows 1st Grade MAP scores and percentiles for the Fall timeframe.
| Percentile | Math | Reading | Language |
|---|---|---|---|
| 1 – 9 | 131-143 | 126-139 | N/A |
| 10 – 19 | 144-149 | 140-145 | N/A |
| 20 – 29 | 150-153 | 145-149 | N/A |
| 30 – 39 | 154-157 | 149-152 | N/A |
| 40 – 49 | 157-160 | 153-156 | N/A |
| 50 – 59 | 160-163 | 156-159 | N/A |
| 60 – 69 | 163-166 | 159-162 | N/A |
| 70 – 79 | 167-170 | 163-166 | N/A |
| 80 – 89 | 171-175 | 167-171 | N/A |
| 90 – 99 | 176-189 | 172-185 | N/A |
Winter
The MAP Scores chart below shows 1st Grade MAP scores and percentiles for the Winter timeframe.
| Percentile | Math | Reading | Language |
|---|---|---|---|
| 1 – 9 | 141-153 | 135-148 | N/A |
| 10 – 19 | 154-159 | 149-154 | N/A |
| 20 – 29 | 160-163 | 155-159 | N/A |
| 30 – 39 | 164-167 | 159-162 | N/A |
| 40 – 49 | 167-170 | 159-162 | N/A |
| 50 – 59 | 170-173 | 159-162 | N/A |
| 60 – 69 | 173-176 | 169-172 | N/A |
| 70 – 79 | 177-180 | 173-176 | N/A |
| 80 – 89 | 181-186 | 177-182 | N/A |
| 90 – 99 | 186-199 | 177-182 | N/A |
Spring
The MAP Scores chart below shows 1st Grade MAP scores and percentiles for the Spring timeframe.
| Percentile | Math | Reading | Language |
|---|---|---|---|
| 1 – 9 | 146-159 | 138-152 | N/A |
| 10 – 19 | 160-165 | 153-159 | N/A |
| 20 – 29 | 165-169 | 159-164 | N/A |
| 30 – 39 | 169-173 | 164-167 | N/A |
| 40 – 49 | 173-176 | 168-171 | N/A |
| 50 – 59 | 176-179 | 171-175 | N/A |
| 60 – 69 | 180-183 | 175-178 | N/A |
| 70 – 79 | 183-187 | 179-183 | N/A |
| 80 – 89 | 187-193 | 183-189 | N/A |
| 90 – 99 | 193-207 | 190-204 | N/A |
2nd Grade MAP Test Scores
The NWEA MAP Growth assessment measures student progress in Math, Reading, and Language. Below are the percentile ranges for each season.
Fall
The NWEA MAP Scores chart below shows 2nd grade MAP scores and percentiles for the fall timeframe. These scores indicate how students compare to their peers nationwide.
| Percentile | Math | Reading | Language |
|---|---|---|---|
| 1 – 9 | 145-158 | 137-152 | 137-152 |
| 10 – 19 | 158-164 | 153-159 | 153-160 |
| 20 – 29 | 164-168 | 160-164 | 160-165 |
| 30 – 39 | 168-171 | 164-168 | 166-169 |
| 40 – 49 | 172-175 | 168-172 | 170-174 |
| 50 – 59 | 175-178 | 172-176 | 174-178 |
| 60 – 69 | 178-181 | 176-180 | 178-182 |
| 70 – 79 | 182-186 | 180-185 | 182-187 |
| 80 – 89 | 186-191 | 185-191 | 188-194 |
| 90 – 99 | 192-205 | 192-208 | 195-211 |
Winter
The table below presents 2nd grade MAP scores and percentiles for the winter timeframe. These values reflect mid-year progress for students.
| Percentile | Math | Reading | Language |
|---|---|---|---|
| 1 – 9 | 154-167 | 146-161 | 148-163 |
| 10 – 19 | 167-173 | 162-168 | 164-170 |
| 20 – 29 | 173-177 | 169-173 | 171-175 |
| 30 – 39 | 177-180 | 173-177 | 176-180 |
| 40 – 49 | 181-184 | 173-177 | 180-183 |
| 50 – 59 | 184-187 | 181-185 | 184-187 |
| 60 – 69 | 187-191 | 185-189 | 188-191 |
| 70 – 79 | 191-195 | 189-193 | 192-196 |
| 80 – 89 | 195-200 | 194-200 | 197-203 |
| 90 – 99 | 201-214 | 200-216 | 204-220 |
Spring
The following table displays 2nd grade MAP scores and percentiles for the spring timeframe. These scores represent student performance towards the end of the academic year.
| Percentile | Math | Reading | Language |
|---|---|---|---|
| 1 – 9 | 158-171 | 150-165 | 151-167 |
| 10 – 19 | 172-178 | 166-172 | 168-174 |
| 20 – 29 | 178-182 | 173-177 | 175-180 |
| 30 – 39 | 182-186 | 177-181 | 180-184 |
| 40 – 49 | 186-189 | 182-185 | 184-188 |
| 50 – 59 | 189-192 | 186-189 | 188-192 |
| 60 – 69 | 193-196 | 189-193 | 192-196 |
| 70 – 79 | 196-200 | 194-198 | 197-201 |
| 80 – 89 | 201-206 | 199-205 | 202-208 |
| 90 – 99 | 207-221 | 205-222 | 209-225 |
3rd Grade MAP Test Scores
The NWEA MAP Growth assessment for 3rd graders evaluates Math, Reading, and Language skills. Below are the percentile scores for each season.
Fall
The following table presents 3rd grade MAP scores and percentiles for the fall timeframe. These scores provide a starting benchmark for the academic year.
| Percentile | Math | Reading | Language |
|---|---|---|---|
| 1 – 9 | 157-170 | 148-164 | 152-167 |
| 10 – 19 | 171-177 | 165-172 | 168-174 |
| 20 – 29 | 177-181 | 169-177 | 175-179 |
| 30 – 39 | 181-185 | 178-182 | 180-183 |
| 40 – 49 | 185-188 | 182-186 | 184-187 |
| 50 – 59 | 188-192 | 187-190 | 188-191 |
| 60 – 69 | 192-195 | 191-195 | 192-195 |
| 70 – 79 | 196-199 | 195-200 | 196-200 |
| 80 – 89 | 200-205 | 201-207 | 201-207 |
| 90 – 99 | 206-220 | 208-225 | 207-223 |
Winter
The table below shows 3rd grade MAP scores and percentiles for the winter timeframe. These values reflect mid-year performance.
| Percentile | Math | Reading | Language |
|---|---|---|---|
| 1 – 9 | 165-178 | 156-172 | 161-176 |
| 10 – 19 | 179-184 | 173-180 | 176-182 |
| 20 – 29 | 185-189 | 180-185 | 183-187 |
| 30 – 39 | 189-192 | 185-189 | 187-191 |
| 40 – 49 | 193-196 | 190-193 | 191-195 |
| 50 – 59 | 196-199 | 194-198 | 195-198 |
| 60 – 69 | 200-203 | 198-202 | 199-202 |
| 70 – 79 | 203-207 | 202-207 | 203-207 |
| 80 – 89 | 208-213 | 207-214 | 207-213 |
| 90 – 99 | 214-228 | 215-231 | 214-229 |
Spring
The final chart represents 3rd grade MAP scores and percentiles for the spring timeframe, reflecting student growth throughout the school year.
| Percentile | Math | Reading | Language |
|---|---|---|---|
| 1 – 9 | 168-182 | 159-175 | 164-179 |
| 10 – 19 | 183-189 | 176-183 | 180-185 |
| 20 – 29 | 189-193 | 183-188 | 186-190 |
| 30 – 39 | 194-197 | 189-193 | 191-194 |
| 40 – 49 | 198-201 | 193-197 | 195-198 |
| 50 – 59 | 201-204 | 197-201 | 198-202 |
| 60 – 69 | 205-208 | 201-205 | 202-206 |
| 70 – 79 | 208-212 | 206-210 | 206-210 |
| 80 – 89 | 213-218 | 211-217 | 211-216 |
| 90 – 99 | 219-234 | 218-235 | 217-232 |
4th Grade MAP Test Scores
Fall
The following table shows NWEA MAP scores for 4th graders during the fall testing period.
| Percentile | Math | Reading | Language |
|---|---|---|---|
| 1 – 9 | 166-180 | 158-174 | 162-177 |
| 10 – 19 | 181-187 | 175-182 | 178-184 |
| 20 – 29 | 187-192 | 183-187 | 185-189 |
| 30 – 39 | 192-196 | 188-192 | 189-193 |
| 40 – 49 | 196-199 | 192-196 | 194-197 |
| 50 – 59 | 200-203 | 197-200 | 197-201 |
| 60 – 69 | 203-207 | 201-205 | 201-205 |
| 70 – 79 | 207-211 | 205-210 | 205-210 |
| 80 – 89 | 212-217 | 211-217 | 210-216 |
| 90 – 99 | 218-233 | 218-236 | 217-232 |
Winter
The chart below shows 4th grade MAP scores and percentiles for the winter timeframe.
| Percentile | Math | Reading | Language |
|---|---|---|---|
| 1 – 9 | 171-186 | 165-181 | 169-184 |
| 10 – 19 | 187-193 | 182-188 | 184-190 |
| 20 – 29 | 194-198 | 189-194 | 191-195 |
| 30 – 39 | 198-202 | 194-198 | 195-199 |
| 40 – 49 | 202-206 | 198-202 | 199-203 |
| 50 – 59 | 206-209 | 202-206 | 203-206 |
| 60 – 69 | 210-213 | 207-211 | 207-210 |
| 70 – 79 | 214-218 | 211-216 | 210-215 |
| 80 – 89 | 219-224 | 216-222 | 215-221 |
| 90 – 99 | 225-241 | 223-240 | 221-236 |
Spring
The following table presents 4th grade MAP scores and percentiles for the spring testing period.
| Percentile | Math | Reading | Language |
|---|---|---|---|
| 1 – 9 | 174-190 | 167-183 | 172-186 |
| 10 – 19 | 191-197 | 184-191 | 187-192 |
| 20 – 29 | 197-202 | 191-196 | 193-197 |
| 30 – 39 | 202-206 | 196-200 | 197-201 |
| 40 – 49 | 207-210 | 201-204 | 201-205 |
| 50 – 59 | 211-214 | 205-209 | 205-208 |
| 60 – 69 | 214-218 | 209-213 | 209-212 |
| 70 – 79 | 219-223 | 213-218 | 213-217 |
| 80 – 89 | 224-230 | 219-225 | 217-223 |
| 90 – 99 | 230-247 | 226-243 | 223-238 |
5th Grade MAP Test Scores
Fall
The following table presents 5th-grade MAP scores and percentiles for the fall testing period.
| Percentile | Math | Reading | Language |
|---|---|---|---|
| 1 – 9 | 174-189 | 166-183 | 170-185 |
| 10 – 19 | 190-196 | 183-190 | 186-191 |
| 20 – 29 | 196-201 | 191-195 | 192-196 |
| 30 – 39 | 201-205 | 196-200 | 197-200 |
| 40 – 49 | 205-209 | 200-204 | 200-204 |
| 50 – 59 | 209-213 | 204-208 | 204-207 |
| 60 – 69 | 213-217 | 209-213 | 208-211 |
| 70 – 79 | 217-221 | 213-218 | 212-216 |
| 80 – 89 | 222-228 | 218-225 | 216-222 |
| 90 – 99 | 229-244 | 225-243 | 223-238 |
Winter
The table below displays 5th-grade MAP scores and percentiles for the winter testing period.
| Percentile | Math | Reading | Language |
|---|---|---|---|
| 1 – 9 | 178-193 | 172-188 | 176-190 |
| 10 – 19 | 194-201 | 189-195 | 191-196 |
| 20 – 29 | 201-206 | 196-200 | 197-201 |
| 30 – 39 | 206-210 | 201-205 | 201-205 |
| 40 – 49 | 211-214 | 205-209 | 205-208 |
| 50 – 59 | 215-218 | 209-213 | 208-212 |
| 60 – 69 | 219-223 | 213-217 | 212-215 |
| 70 – 79 | 223-228 | 217-222 | 216-220 |
| 80 – 89 | 228-234 | 222-229 | 220-226 |
| 90 – 99 | 235-252 | 229-246 | 226-241 |
Spring
The table below shows the 5th-grade MAP scores and percentiles for the spring testing period.
| Percentile | Math | Reading | Language |
|---|---|---|---|
| 1 – 9 | 180-196 | 174-190 | 178-192 |
| 10 – 19 | 197-204 | 191-197 | 192-198 |
| 20 – 29 | 205-210 | 198-202 | 198-202 |
| 30 – 39 | 210-214 | 203-207 | 203-206 |
| 40 – 49 | 215-218 | 207-211 | 207-210 |
| 50 – 59 | 219-223 | 211-215 | 210-213 |
| 60 – 69 | 223-227 | 215-219 | 214-217 |
| 70 – 79 | 228-232 | 219-224 | 217-221 |
| 80 – 89 | 233-239 | 224-231 | 222-227 |
| 90 – 99 | 240-258 | 231-248 | 228-243 |
6th Grade MAP Test Scores
Fall
The following table shows 6th-grade MAP scores and percentiles for the fall testing period.
| Percentile | Math | Reading | Language |
|---|---|---|---|
| 1 – 9 | 177-193 | 172-188 | 176-190 |
| 10 – 19 | 194-201 | 189-196 | 191-197 |
| 20 – 29 | 201-206 | 196-201 | 197-201 |
| 30 – 39 | 206-210 | 202-206 | 202-205 |
| 40 – 49 | 211-214 | 206-210 | 206-209 |
| 50 – 59 | 215-218 | 210-214 | 209-213 |
| 60 – 69 | 219-223 | 214-218 | 213-217 |
| 70 – 79 | 223-228 | 219-223 | 217-221 |
| 80 – 89 | 228-235 | 224-230 | 222-227 |
| 90 – 99 | 235-252 | 231-248 | 228-243 |
Winter
This table provides the 6th-grade MAP scores and percentiles for the winter testing period.
| Percentile | Math | Reading | Language |
|---|---|---|---|
| 1 – 9 | 181-197 | 177-192 | 180-194 |
| 10 – 19 | 198-205 | 193-200 | 195-201 |
| 20 – 29 | 205-210 | 200-205 | 201-205 |
| 30 – 39 | 211-215 | 205-209 | 206-209 |
| 40 – 49 | 215-219 | 210-213 | 209-212 |
| 50 – 59 | 220-223 | 214-217 | 213-216 |
| 60 – 69 | 224-228 | 218-222 | 216-220 |
| 70 – 79 | 228-233 | 222-227 | 220-224 |
| 80 – 89 | 234-240 | 227-233 | 225-230 |
| 90 – 99 | 241-258 | 234-251 | 231-245 |
Spring
The table below shows MAP scores and percentiles for 6th-grade students during the spring testing period.
| Percentile | Math | Reading | Language |
|---|---|---|---|
| 1 – 9 | 182-199 | 178-194 | 182-195 |
| 10 – 19 | 200-208 | 195-201 | 196-202 |
| 20 – 29 | 208-213 | 202-206 | 202-206 |
| 30 – 39 | 214-218 | 207-211 | 202-206 |
| 40 – 49 | 218-222 | 211-215 | 211-214 |
| 50 – 59 | 223-227 | 215-219 | 214-217 |
| 60 – 69 | 227-232 | 219-223 | 218-221 |
| 70 – 79 | 232-237 | 224-228 | 221-225 |
| 80 – 89 | 238-244 | 229-235 | 226-231 |
| 90 – 99 | 245-264 | 236-253 | 232-247 |
7th Grade MAP Test Scores
Fall
The following table shows 7th-grade MAP scores and percentiles for the fall testing period.
| Percentile | Math | Reading | Language |
|---|---|---|---|
| 1 – 9 | 180-197 | 176-192 | 178-193 |
| 10 – 19 | 198-205 | 193-200 | 194-200 |
| 20 – 29 | 206-211 | 200-205 | 200-205 |
| 30 – 39 | 211-215 | 206-210 | 205-209 |
| 40 – 49 | 216-220 | 210-214 | 209-212 |
| 50 – 59 | 220-224 | 214-218 | 213-216 |
| 60 – 69 | 225-229 | 218-222 | 216-220 |
| 70 – 79 | 229-234 | 223-228 | 220-225 |
| 80 – 89 | 235-242 | 228-234 | 225-231 |
| 90 – 99 | 243-261 | 235-253 | 232-247 |
Winter
This table provides 7th-grade MAP scores and percentiles for the winter testing period.
| Percentile | Math | Reading | Language |
|---|---|---|---|
| 1 – 9 | 182-200 | 179-195 | 182-196 |
| 10 – 19 | 201-208 | 196-203 | 197-203 |
| 20 – 29 | 209-214 | 203-208 | 203-207 |
| 30 – 39 | 215-219 | 209-213 | 208-211 |
| 40 – 49 | 219-224 | 213-217 | 212-215 |
| 50 – 59 | 224-228 | 217-221 | 215-219 |
| 60 – 69 | 229-233 | 221-225 | 219-222 |
| 70 – 79 | 233-239 | 226-230 | 223-227 |
| 80 – 89 | 239-246 | 231-237 | 227-233 |
| 90 – 99 | 247-266 | 238-255 | 234-249 |
Spring
The following table presents 7th-grade MAP scores and percentiles for the spring testing period.
| Percentile | Math | Reading | Language |
|---|---|---|---|
| 1 – 9 | 183-202 | 180-196 | 183-197 |
| 10 – 19 | 203-210 | 197-204 | 198-204 |
| 20 – 29 | 211-216 | 205-209 | 204-208 |
| 30 – 39 | 217-222 | 210-214 | 209-212 |
| 40 – 49 | 222-226 | 214-218 | 213-216 |
| 50 – 59 | 227-231 | 218-222 | 216-220 |
| 60 – 69 | 231-236 | 223-226 | 220-224 |
| 70 – 79 | 236-242 | 227-232 | 224-228 |
| 80 – 89 | 242-250 | 232-238 | 229-234 |
| 90 – 99 | 251-270 | 239-256 | 235-250 |
8th Grade MAP Test Scores
Fall
This table shows 8th-grade MAP scores and percentiles for the fall testing period.
| Percentile | Math | Reading | Language |
|---|---|---|---|
| 1 – 9 | 181-200 | 178-195 | 181-196 |
| 10 – 19 | 201-208 | 196-203 | 197-203 |
| 20 – 29 | 209-214 | 204-209 | 204-208 |
| 30 – 39 | 215-220 | 209-213 | 209-212 |
| 40 – 49 | 220-224 | 214-218 | 213-216 |
| 50 – 59 | 225-229 | 218-222 | 217-220 |
| 60 – 69 | 230-234 | 222-226 | 221-224 |
| 70 – 79 | 235-240 | 227-232 | 225-229 |
| 80 – 89 | 241-248 | 232-239 | 230-236 |
| 90 – 99 | 249-269 | 240-258 | 237-253 |
Winter
This table displays NWEA MAP scores for 8th-grade students during the winter testing period.
| Percentile | Math | Reading | Language |
|---|---|---|---|
| 1 – 9 | 183-202 | 182-198 | 184-198 |
| 10 – 19 | 203-211 | 199-206 | 199-205 |
| 20 – 29 | 212-217 | 206-211 | 206-210 |
| 30 – 39 | 218-223 | 212-216 | 210-214 |
| 40 – 49 | 223-228 | 216-220 | 214-217 |
| 50 – 59 | 228-233 | 221-224 | 218-221 |
| 60 – 69 | 233-238 | 225-229 | 221-225 |
| 70 – 79 | 238-244 | 229-234 | 225-229 |
| 80 – 89 | 244-252 | 235-241 | 230-235 |
| 90 – 99 | 253-273 | 242-259 | 236-251 |
Spring
The following table shows NWEA MAP scores for 8th-grade students for the spring testing period.
| Percentile | Math | Reading | Language |
|---|---|---|---|
| 1 – 9 | 184-204 | 182-199 | 185-199 |
| 10 – 19 | 205-213 | 200-207 | 200-206 |
| 20 – 29 | 214-219 | 207-212 | 206-211 |
| 30 – 39 | 220-225 | 213-217 | 211-215 |
| 40 – 49 | 225-230 | 217-221 | 215-218 |
| 50 – 59 | 230-235 | 222-225 | 219-222 |
| 60 – 69 | 235-240 | 226-230 | 222-226 |
| 70 – 79 | 241-246 | 231-235 | 226-230 |
| 80 – 89 | 247-255 | 236-242 | 231-237 |
| 90 – 99 | 256-277 | 243-261 | 237-253 |
9th Grade MAP Test Scores.
Fall
The table below shows NWEA MAP scores for 9th-grade students in the fall testing period.
| Percentile | Math | Reading | Language |
|---|---|---|---|
| 1 – 9 | 180-200 | 175-193 | 181-196 |
| 10 – 19 | 201-209 | 195-202 | 197-203 |
| 20 – 29 | 210-215 | 203-208 | 204-208 |
| 30 – 39 | 216-221 | 209-214 | 209-212 |
| 40 – 49 | 221-226 | 214-218 | 213-216 |
| 50 – 59 | 226-231 | 219-223 | 217-220 |
| 60 – 69 | 231-236 | 224-228 | 221-224 |
| 70 – 79 | 237-242 | 229-234 | 225-229 |
| 80 – 89 | 243-251 | 235-242 | 230-236 |
| 90 – 99 | 252-273 | 243-263 | 237-253 |
Winter
This table lists NWEA MAP scores and percentiles for 9th graders during the winter testing period.
| Percentile | Math | Reading | Language |
|---|---|---|---|
| 1 – 9 | 182-202 | 177-195 | 183-198 |
| 10 – 19 | 203-211 | 197-204 | 199-205 |
| 20 – 29 | 212-218 | 205-210 | 205-210 |
| 30 – 39 | 218-223 | 211-215 | 210-214 |
| 40 – 49 | 224-228 | 216-220 | 214-218 |
| 50 – 59 | 229-233 | 221-225 | 218-222 |
| 60 – 69 | 234-239 | 225-230 | 222-226 |
| 70 – 79 | 239-245 | 230-236 | 226-231 |
| 80 – 89 | 246-253 | 236-243 | 231-237 |
| 90 – 99 | 254-275 | 245-264 | 238-254 |
Spring
This table outlines NWEA MAP scores and percentiles for 9th-grade students in the spring testing period.
| Percentile | Math | Reading | Language |
|---|---|---|---|
| 1 – 9 | 182-202 | 177-196 | 183-198 |
| 10 – 19 | 204-212 | 197-205 | 199-205 |
| 20 – 29 | 213-219 | 205-211 | 206-210 |
| 30 – 39 | 219-224 | 211-216 | 211-215 |
| 40 – 49 | 225-230 | 217-221 | 215-219 |
| 50 – 59 | 230-235 | 221-226 | 219-223 |
| 60 – 69 | 235-240 | 225-229 | 222-226 |
| 70 – 79 | 240-245 | 229-234 | 226-230 |
| 80 – 89 | 250-258 | 239-246 | 234-240 |
| 90 – 99 | 260-282 | 247-266 | 241-257 |
10th Grade MAP Test Scores
Fall
This table displays NWEA MAP scores and percentiles for 10th-grade students in the fall testing period.
| Percentile | Math | Reading | Language |
|---|---|---|---|
| 1 – 9 | 182-202 | 180-197 | 184-199 |
| 10 – 19 | 203-211 | 199-206 | 199-206 |
| 20 – 29 | 212-218 | 206-212 | 206-210 |
| 30 – 39 | 218-223 | 212-216 | 211-215 |
| 40 – 49 | 224-229 | 217-221 | 215-218 |
| 50 – 59 | 229-234 | 221-226 | 219-222 |
| 60 – 69 | 234-239 | 225-229 | 222-225 |
| 70 – 79 | 240-245 | 229-234 | 226-230 |
| 80 – 89 | 249-257 | 238-245 | 233-239 |
| 90 – 99 | 258-280 | 246-265 | 240-255 |
Winter
This table provides NWEA MAP scores and percentiles for 10th-grade students during the winter testing period.
| Percentile | Math | Reading | Language |
|---|---|---|---|
| 1 – 9 | 183-204 | 181-199 | 185-200 |
| 10 – 19 | 205-213 | 200-207 | 201-207 |
| 20 – 29 | 214-220 | 208-213 | 207-212 |
| 30 – 39 | 220-225 | 214-218 | 212-216 |
| 40 – 49 | 226-231 | 219-223 | 217-220 |
| 50 – 59 | 232-236 | 224-228 | 221-224 |
| 60 – 69 | 237-242 | 228-232 | 224-228 |
| 70 – 79 | 243-248 | 233-238 | 228-233 |
| 80 – 89 | 249-257 | 238-245 | 233-239 |
| 90 – 99 | 258-280 | 246-265 | 240-255 |
Spring
This table shows NWEA MAP scores and percentiles for 10th-grade students during the spring testing period.
| Percentile | Math | Reading | Language |
|---|---|---|---|
| 1 – 9 | 184-205 | 182-200 | 186-202 |
| 10 – 19 | 207-215 | 201-208 | 202-209 |
| 20 – 29 | 216-222 | 209-214 | 209-214 |
| 30 – 39 | 223-228 | 215-220 | 214-218 |
| 40 – 49 | 229-234 | 220-224 | 218-222 |
| 50 – 59 | 234-239 | 225-229 | 222-226 |
| 60 – 69 | 240-245 | 229-234 | 226-230 |
| 70 – 79 | 246-252 | 234-240 | 230-235 |
| 80 – 89 | 252-261 | 240-247 | 235-241 |
| 90 – 99 | 262-285 | 248-268 | 242-258 |
11th Grade MAP Test Scores
Fall
This table presents NWEA MAP scores and percentiles for 11th-grade students in the fall testing period.
| Percentile | Math | Reading | Language |
|---|---|---|---|
| 1 – 9 | 184-204 | 182-200 | 186-201 |
| 10 – 19 | 205-214 | 201-208 | 202-208 |
| 20 – 29 | 214-220 | 209-214 | 208-212 |
| 30 – 39 | 221-226 | 214-219 | 213-216 |
| 40 – 49 | 227-231 | 219-223 | 217-220 |
| 50 – 59 | 232-236 | 224-228 | 221-224 |
| 60 – 69 | 237-242 | 228-232 | 224-228 |
| 70 – 79 | 243-248 | 233-238 | 228-233 |
| 80 – 89 | 249-257 | 238-245 | 233-239 |
| 90 – 99 | 258-280 | 246-265 | 240-255 |
Winter
This table provides NWEA MAP scores and percentiles for 11th-grade students during the winter testing period.
| Percentile | Math | Reading | Language |
|---|---|---|---|
| 1 – 9 | 185-205 | 183-201 | 187-202 |
| 10 – 19 | 207-215 | 202-209 | 203-209 |
| 20 – 29 | 216-222 | 210-215 | 209-214 |
| 30 – 39 | 223-228 | 215-220 | 214-218 |
| 40 – 49 | 228-233 | 220-224 | 218-221 |
| 50 – 59 | 233-238 | 225-229 | 222-225 |
| 60 – 69 | 239-244 | 229-233 | 226-229 |
| 70 – 79 | 244-250 | 234-239 | 230-234 |
| 80 – 89 | 251-259 | 240-246 | 234-240 |
| 90 – 99 | 260-282 | 247-266 | 241-257 |
Spring
This table shows NWEA MAP scores and percentiles for 11th-grade students during the spring testing period.
| Percentile | Math | Reading | Language |
|---|---|---|---|
| 1 – 9 | 184-205 | 182-200 | 186-202 |
| 10 – 19 | 207-215 | 201-208 | 202-209 |
| 20 – 29 | 216-222 | 209-214 | 209-214 |
| 30 – 39 | 223-228 | 215-220 | 214-218 |
| 40 – 49 | 229-234 | 220-224 | 218-222 |
| 50 – 59 | 234-239 | 225-229 | 222-226 |
| 60 – 69 | 240-245 | 229-234 | 226-230 |
| 70 – 79 | 246-252 | 234-240 | 230-235 |
| 80 – 89 | 252-261 | 240-247 | 235-241 |
| 90 – 99 | 262-285 | 248-268 | 242-258 |
12th Grade MAP Test Scores
Fall
The following table shows 12th-grade MAP scores and percentiles for the fall testing period.
| Percentile | Math | Reading | Language |
|---|---|---|---|
| 1 – 9 | 183-204 | 179-198 | N/A |
| 10 – 19 | 205-214 | 199-207 | N/A |
| 20 – 29 | 215-221 | 208-213 | N/A |
| 30 – 39 | 222-227 | 214-218 | N/A |
| 40 – 49 | 228-232 | 219-223 | N/A |
| 50 – 59 | 233-238 | 224-228 | N/A |
| 60 – 69 | 238-244 | 229-233 | N/A |
| 70 – 79 | 244-250 | 234-239 | N/A |
| 80 – 89 | 251-260 | 240-247 | N/A |
| 90 – 99 | 261-283 | 249-269 | N/A |
Winter
This table provides 12th-grade MAP scores and percentiles for the winter testing period.
| Percentile | Math | Reading | Language |
|---|---|---|---|
| 1 – 9 | 180-202 | 175-195 | N/A |
| 10 – 19 | 204-213 | 197-205 | N/A |
| 20 – 29 | 214-221 | 206-212 | N/A |
| 30 – 39 | 221-227 | 213-218 | N/A |
| 40 – 49 | 227-233 | 218-223 | N/A |
| 50 – 59 | 233-239 | 224-229 | N/A |
| 60 – 69 | 239-245 | 229-234 | N/A |
| 70 – 79 | 245-252 | 235-241 | N/A |
| 80 – 89 | 253-262 | 242-250 | N/A |
| 90 – 99 | 263-287 | 251-273 | N/A |
Spring
The following table presents 12th-grade MAP scores and percentiles for the spring testing period.
| Percentile | Math | Reading | Language |
|---|---|---|---|
| 1 – 9 | 177-201 | 171-193 | N/A |
| 10 – 19 | 203-213 | 195-204 | N/A |
| 20 – 29 | 213-221 | 205-212 | N/A |
| 30 – 39 | 221-227 | 212-218 | N/A |
| 40 – 49 | 228-234 | 218-224 | N/A |
| 50 – 59 | 234-240 | 224-230 | N/A |
| 60 – 69 | 240-246 | 230-236 | N/A |
| 70 – 79 | 247-254 | 236-243 | N/A |
| 80 – 89 | 255-264 | 244-253 | N/A |
| 90 – 99 | 266-291 | 254-278 | N/A |
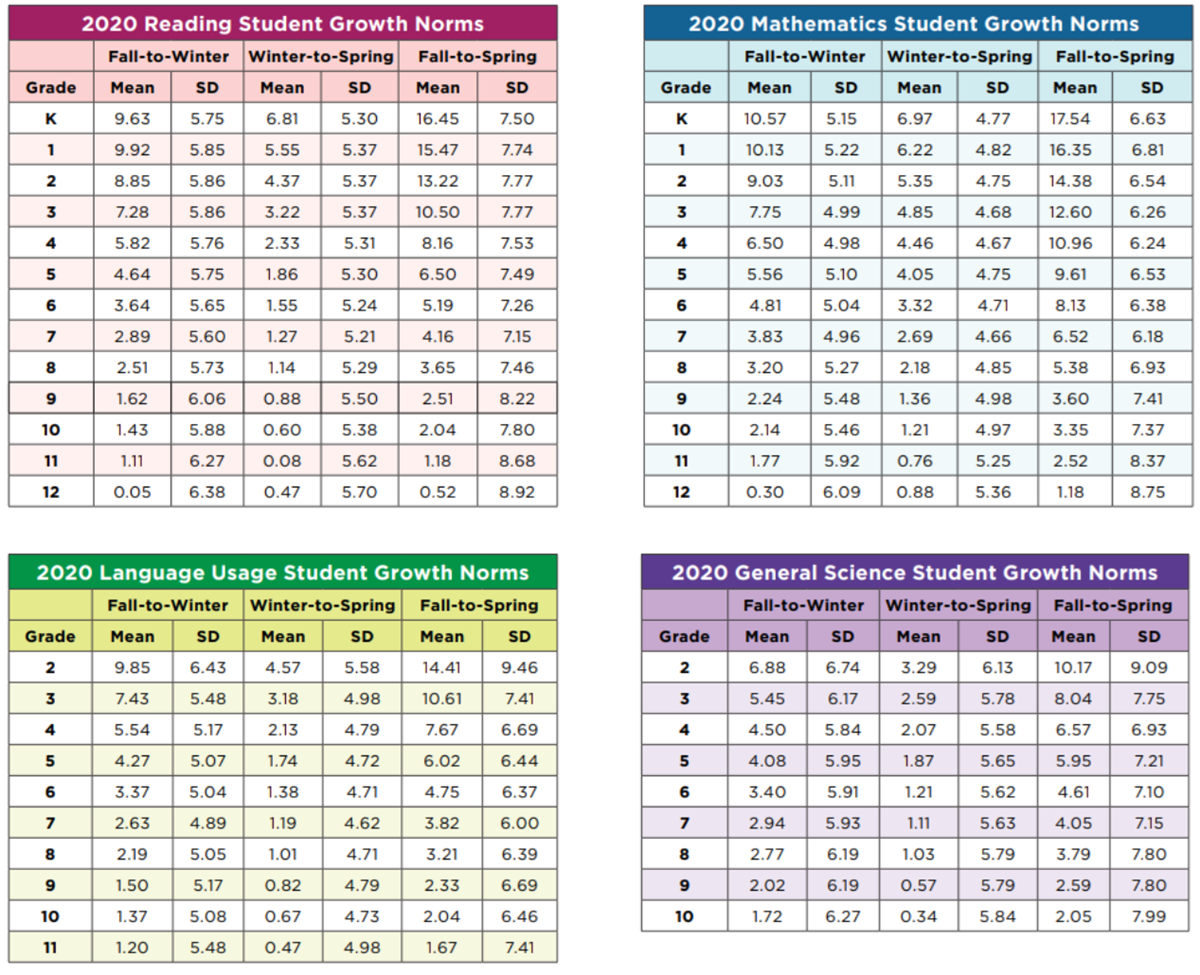
Map Growth: NWEA Map Test Scores by Grade Level 2024-2025 Norms Chart.
Map Scores – Student Growth Norms.
The 2020 MAP Growth Study shows that a child’s progress depends on where they start. Children who begin at a lower level often show more growth because they have more room to improve. The average (50th percentile) is used as the starting point. This means if your child starts below average, they might make faster progress, while those starting above average may show smaller increases since they are already high achievers. These growth measures also take the number of school days into account, giving a clear picture of how a child’s RIT score changes over time.
Map Scores – School Norms Explained.
School norms look at how groups of students perform together. A group’s progress is usually more consistent than that of individual students. Comparing a school’s averages with those from other schools helps show how well the school is doing overall. This approach highlights strong school performance and helps identify areas that might need extra support. In short, school norms provide a reliable way to see how students, as a group, are growing over time.
School norms show how a whole grade at one school compares with the same grade at another school or with public schools across the country. School and district leaders use this information to track overall school performance over time and to compare how different schools are doing.
The tables below display school growth norms. They include SD (standard deviation) columns that show the amount of variation in growth scores. Groups of students usually show less variation in their progress than individual students do.
A Parent’s Guide to Understanding NWEA MAP Scores.
As a parent, it’s important to understand what your child’s NWEA MAP scores mean so you can actively support their academic journey. The guide below guide breaks down how to interpret MAP scores, what the graphs and tables show, and how to use this information to help your child succeed.
What Are MAP Scores and Why Do They Matter?
MAP (Measures of Academic Progress) scores are designed to show your child’s academic development and how their performance compares nationally. You’ll see two important numbers on your child’s report:
- Percentile Rankings: How your child compares to other students nationwide in the same grade.
- RIT Scores (Rasch Unit): A scale that tracks growth over time, independent of grade level.
Example: A 3rd grader with a math RIT score of 190 is about average; a score of 230 is considered advanced. For an 8th grader, average may be around 220.
How to Read Your Child’s MAP Student Profile:

Understanding Your Child’s MAP Growth Report: A Guide for Parents
Getting Started
- Best browser to use: Use Google Chrome for the best experience. Avoid Internet Explorer and older Safari versions.
- School setup: Your school sets how many weeks of instruction happened between MAP tests. This helps scores compare fairly to other students.
- Finding your child’s report: Your report will typically be on your school’s login page. Go to View Reports > MAP Reports and use Student Quick Search. Refer to the NWEA homepage for more help.
- Looking at past scores: Use the menu at the top to select different terms. An asterisk (*) means the score is from an earlier term.
- Switching students: You can easily change the student, class, or term you’re viewing.
- Percentile colors: These colors show how your child’s score compares to other students nationally with similar instructional time.
Printing Reports for Meetings
To prepare for conferences, you can print reports by clicking “Print and Share > Batch PDF”. The Family Report is best for parents.
Tip: Avoid the “Instructional Areas” option unless needed—it uses a lot of paper.
Subject Scores Explained
- RIT Score: The main score for each subject.
- Standard Error: Indicates how precise the score is.
- Minutes: How long the test took (excluding breaks).
- Rapid Guessing %: Shows if your child clicked through questions too quickly.
- Estimated Impact: Shows how your child might have scored with better focus.
Highlights and Recommendations
The Highlights section shows a summary of the most recent scores, with helpful suggestions for growth.
Comparing Scores
This section helps answer important questions like:
- Is my child improving?
- Are they on track for state or college tests?
- What reading level is right for them?
Understanding Growth
Even if a child has a lower score, strong growth shows they’re learning and progressing. Look at:
- Conditional Growth Index: Compares your child’s growth to similar students.
- Projected Growth: How much they were expected to grow.
- Observed Growth: How much they actually grew.
Projections for State and College Tests
These show how your child might do on tests like the SAT or ACT. Not all grades or states have projections available.
Reading and Math Skill Levels
- Lexile® Measure: Helps find books at your child’s reading level. Visit Lexile.com.
- Quantile® Measure: Helps match math work to your child’s skill level.
Instructional Areas
This section breaks scores into smaller subject areas, showing both strengths and areas for growth. Labels you might see include:
- Relative Strength: A stronger area for your child.
- Suggested Area of Focus: A part they might need to work on.
Growth Over Time
This graph shows how your child’s scores have changed across terms. It includes:
- Projected Score: Where your child was expected to be.
- Average Score: National average score for similar students.
- District Average: Average for your school district.
- Goals: Displays progress toward any goals set with the teacher.
Setting Growth Goals
- Challenge but be realistic: Use your child’s past scores to set a goal they can reach with effort.
- Start with the projected growth: It’s personalized based on similar students.
- Percentile colors help: These show where your child stands and what’s needed to reach the next level.
- Include a simple plan: Add steps or strategies to help your child meet the goal.
Note: Projections and comparisons depend on the national norms, your child’s grade level, and school settings.
How to Read Your Child’s MAP Progress Report.
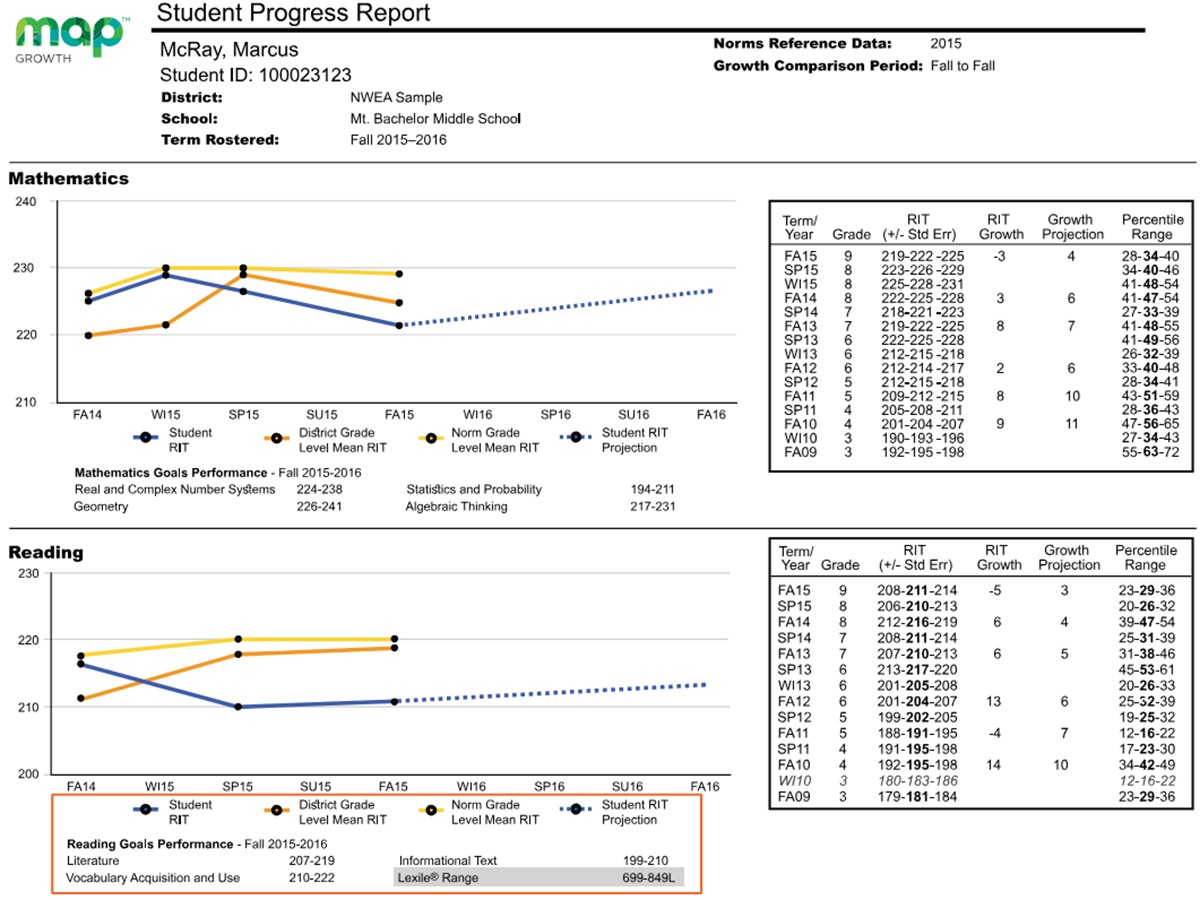
What Is the Student Progress Report?
This report shows your child’s progress in reading and math over time. It helps you see how much your child has grown from one testing season to the next (like from Fall to Winter).
If you want a simpler version of this report, ask for the Family Report.
Which Tests Are Included?
The report includes scores from the following tests:
- MAP Growth
- MAP Screening
- MAP Growth K‑2 (for younger students)
Who Can See This Report?
Teachers, school administrators, and district testing coordinators can access this report.
Previous Test Data
It includes all past test scores, even ones outside the regular testing dates. These appear in gray if selected in the full report view.
Understanding the Growth Chart
This chart compares your child’s test scores (called “RIT scores”) with:
- District Average: Average score of students in the same grade and school district.
- National Norms: Average score of students nationwide, based on NWEA studies.
- Projected Score: A prediction of what your child might score on the next test, based on past growth.
How Your Child Did in Different Skill Areas
The report breaks down how your child performed in different subjects or skill areas. You might see words like:
- Low: Below the 21st percentile
- LoAvg (Low Average): 21st–40th percentile
- Avg (Average): 41st–60th percentile
- HiAvg (High Average): 61st–80th percentile
- High: 81st percentile or higher
If you see an asterisk (*), it means there wasn’t enough data to calculate a score in that area.
Reading Level – Lexile® Range
If your child took a reading test, the report shows a Lexile® range. This helps you find books that match your child’s reading level.
Details About Past Tests
This section shows every test your child has taken, including:
- Term & Grade: When and what grade the test was taken in.
- RIT Score: Your child’s actual test score.
- RIT Growth: How much your child improved between two tests.
- Growth Projection: How much students like your child typically grow.
- Percentile Rank: How your child’s score compares to others nationally.
Tests shown in gray were valid but taken outside the regular testing window. They don’t count toward growth calculations.
Important Report Settings
Growth Comparison Period
This is the time period used to measure how much your child has grown in learning.
Goal Ranges
Choose whether to show subject scores as descriptive levels (like “High” or “Avg”) or actual RIT numbers.
Reference Scores
This setting decides if your report compares your child to the district average and national norms. If district testing isn’t complete, district averages won’t appear.
Test Events to Include
- Growth Only: Shows only tests used to measure growth.
- All Valid: Includes every valid test your child has taken.
Graph Style
You can choose to show your child’s growth in a bar chart or line graph.
PDF Output Options
If schools want to email reports, they can choose to make one PDF per student.
Quick Reference Page
Schools can include a summary page designed just for parents and teachers, to help explain the report.
Each MAP report includes a detailed graph and a table. These help you visualize your child’s academic growth in subjects like Math and Reading.
Key Elements of the MAP Score Graph:
- Testing Periods (Horizontal Axis): Shows when the tests were taken (e.g., Fall, Winter, Spring).
- RIT Scores (Vertical Axis): Higher RIT scores reflect higher academic performance.
- Blue Line (Student RIT): Your child’s scores over time.
- Orange Line (District Average): Average score for students in the same grade and district.
- Yellow Line (National Norms): National average for that grade and subject.
- Blue Dotted Line (Projection): Expected growth based on past performance.
Tip: If your child’s blue line is trending upward and above the orange and yellow lines, they’re doing great! If not, it may be time to discuss learning strategies with their teacher.
Understanding the NWEA Map Test Progress Table.
This table appears next to the graph and gives you the data in numbers. Here’s what to look for:
- Term: The testing period (e.g., Fall 2023).
- RIT Score: Your child’s academic level, with a range showing score variability.
- Percentile Range: Indicates how your child performed compared to peers.
- RIT Growth: Measures improvement since the last test.
- Growth Projection: How much growth is expected based on norms.
- Projected RIT: Forecast of your child’s next expected score.
Example: If your child scores 205 this winter and the projected RIT was 200, they’re ahead of expectations. If they scored 195, some extra support might be helpful.
What Do the Descriptors Mean?
Descriptors break down your child’s performance in specific subject areas:
- Math: Skills like algebra, geometry, data analysis, and number systems.
- Language Usage: Grammar, punctuation, writing style, and mechanics.
- Science: Covers life, physical, and earth/space sciences.
- Reading: Includes fiction, informational texts, and vocabulary skills.
Lexile Range: This tells you what level of reading materials your child can handle (e.g., 800L–1000L). It helps you pick the right books at home.
Family Report Growth Chart
This is often what teachers share with you during conferences. It’s designed with parents in mind: simple visuals, color-coded percentiles, and clear projections.
- Color Key: Easy-to-read markers for national percentile ranges.
- Growth Goals: Based on national averages to help set expectations.
- College Readiness: Some charts may include college benchmarks.
Helping Your Child Succeed with MAP Scores
1. Set and Track Realistic Goals
- Use the MAP scores to identify areas for improvement.
- Celebrate small wins and progress to build motivation.
2. Manage Test Anxiety
- Keep open communication with your child about testing and Test Anxiety.
- Promote relaxation techniques like deep breathing.
- Make sure they get enough sleep and proper nutrition.
3. Encourage a Growth Mindset
- Focus on effort, not just results.
- Reinforce that learning is a journey and every test is a step forward.
Frequently Asked Questions
What’s the highest MAP score?
While MAP scores can reach up to 350, the focus is on growth, not perfection.
How can I check MAP scores?
Schools usually provide access through a parent portal or by request from your child’s teacher.
What qualifies as a gifted score?
Typically, scoring in the 95th percentile or above (around a 240 RIT or higher) may qualify as gifted, but this varies by school district.
Thanbk you for viditing. By understanding your child’s MAP scores, you’re better equipped to support their education, celebrate their achievements, and address any challenges with confidence. We also cover iReady Diagnostic Scores by Grade Math, iReady Diagnostic Scores 2024-2025 Charts (Reading), and SAT Scores.
Good morning.
my 6th grader rocked a 271 on her math score. I’m trying to understand if the tests are comparable across grades? that is: would the 271 score she earned against the questions she took some weeks ago have been the same score if she’d been in 8th or 10th grade? or are those tests’ questions “starting” at a different point -making such cross-grade comparisons void?