
i-Ready Diagnostic Scores K–12 Scale Score Placement Tables 2023-2024 – Math
These are the i-Ready Diagnostic Grades K–12 Scale Score placement tables for Math, for the school year 2023-2024.
Looking for the iReady Percentiles and Diagnostics scores for Math for the year 2024-2025? Find them at the iReady Diagnostic Scores 2024-2025 page.
Please also check out the following pages:
iReady Diagnostic Scores by Grade Level Math 2025
iReady Diagnostic Scores by Grade Level Math (Chart) 2025
iReady Diagnostic Scores by Grade Level Reading 2025
iReady Diagnostic Scores by Grade Level Math (Chart) 2025
iReady Levels
What is a Good iReady Score?
i-Ready Login
i-Ready Math
i-Ready Reading
What Are the i-Ready Placement Tables and Assessment Scores?
The i-Ready Diagnostic is designed to give both parents and students a clear picture of a learner’s current skill level. By taking these assessments, teachers can figure out each student’s grade-level placement and make the best choices about which lessons to focus on.
After a student completes the assessment, i-Ready calculates both an overall score and individual scores for each subject area (called “domains”). The overall score represents how the student performed on all the questions combined, while each domain score shows how they did on specific skills, such as reading comprehension or math operations.
These scores are then compared to the i-Ready Placement Tables, which are like a roadmap showing where students should be at various points in the school year. i-Ready uses specific score ranges to determine whether a student is on track, ahead, or in need of extra support. Created with help from more than 100 educators, this system ensures that each child’s progress is measured in a consistent, research-backed way.
Teachers use these placement scores throughout the year to see if students are moving to higher skill levels or if they need more practice on certain concepts. This makes it easier for both families and teachers to spot growth, celebrate achievements, and target areas where students can benefit from extra help.
How to Read the i-Ready Placement Tables.
- Navigate to the appropriate placement table.
- Locate the student’s current grade in the first column to ascertain their relative placement levels. (It’s important for educators familiar with previous editions to note that the layout of rows and columns has been updated in this version).
- Identify the student’s score range and refer to the corresponding column label to determine the student’s precise grade-level placement. The color coding within each cell matches the score report colors, indicating relative placement levels.
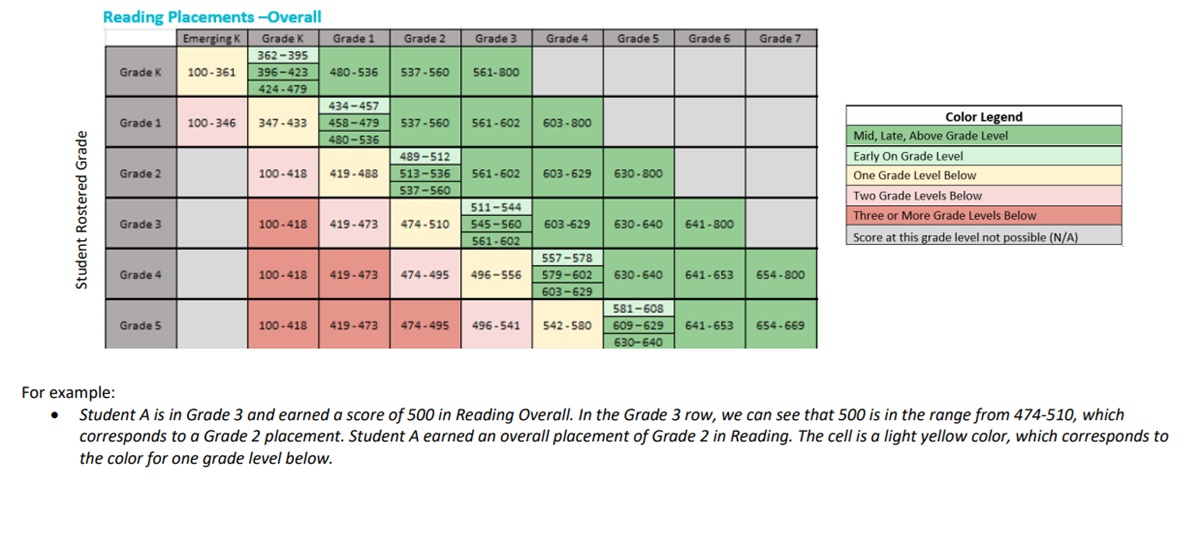
As seen in the image above, if a student in the third grade achieves a reading overall score of 500, this score falls within the 474-510 range, indicating a second-grade reading level. This placement is visually represented by a light yellow color in the table, signifying the student is performing one grade level below in reading.
i-Ready Diagnostics Scores placements tables for Mathematics 2023-2024 – Overall.
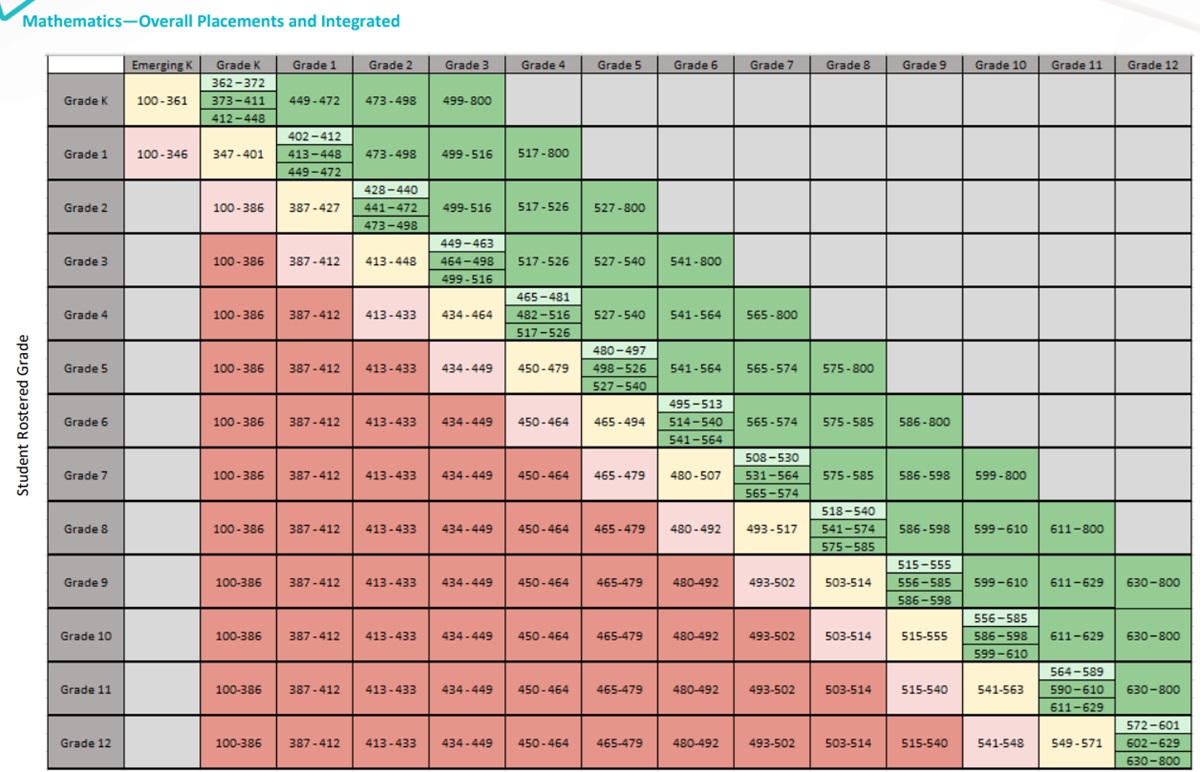
The i-Ready Math Overall Score is the overall score that combines the following Math Scores domains:
- Algebra and Algebraic Thinking Placements
- Number and Operations Placements
- Geometry Placements
- Measurement and Data
i got 540 as a seventh grader in math and 672 in reading