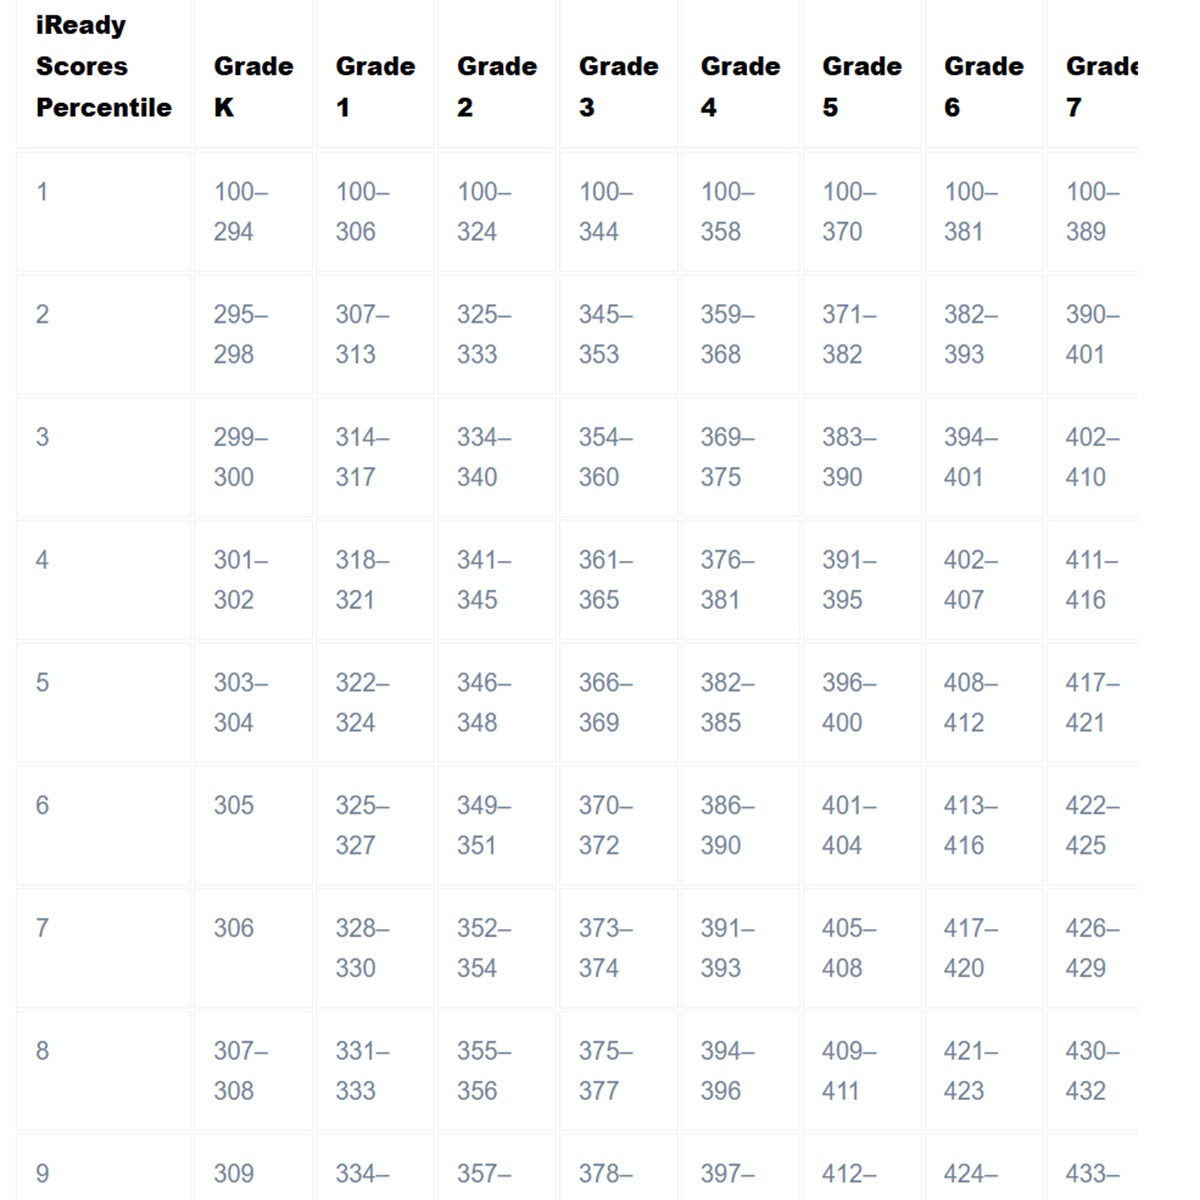
Fall 2024-2025 – i-Ready Diagnostic Scores By Grade in Math (Percentiles).
In Short: The table below shows the Fall i-Ready Diagnostic for Mathematics percentile-to-score conversion ranges by grade level for iReady Diagnostics. The scores were taken between the beginning of the school year and November 15. The analyses were based on the 2022–2023 academic year. The scores officially apply to the 2024-2025 school year.
iReady Scores Percentile
Grade K
Grade 1
Grade 2
Grade 3
Grade 4
Grade 5
Grade 6
Grade 7
Grade 8
1
100–294
100–306
100–324
100–344
100–358
100–370
100–381
100–389
100–393
2
295–298
307–313
325–333
345–353
359–368
371–382
382–393
390–401
394–406
3
299–300
314–317
334–340
354–360
369–375
383–390
394–401
402–410
407–414
4
301–302
318–321
341–345
361–365
376–381
391–395
402–407
411–416
415–421
5
303–304
322–324
346–348
366–369
382–385
396–400
408–412
417–421
422–425
6
305
325–327
349–351
370–372
386–390
401–404
413–416
422–425
426–430
7
306
328–330
352–354
373–374
391–393
405–408
417–420
426–429
431–433
8
307–308
331–333
355–356
375–377
394–396
409–411
421–423
430–432
434–436
9
309
334–335
357–359
378–380
397–398
412–413
424–426
433–434
437–439
10
310
336–337
360–361
381–382
399–401
414–416
427–428
435–436
440–441
11
311
338–339
362–363
383–384
402–403
417–419
429–431
437–439
442–444
12
312
340
364–365
385–386
404–405
420–421
432–433
440
445–446
13
313
341–342
366
387–388
406–407
422–423
434
441–442
447–448
14
314
343
367–368
389–390
408–409
424
435–436
443–444
449–450
15
315
344
369
391–392
410–411
425–426
437–438
445–446
451–452
16
316
345
370
393–394
412
427–428
439
447
453
17
316
346
371
395
413–414
429–430
440–441
448–449
454–455
18
317
347
372
396
415–416
431
442
450–451
456–457
19
318
348
373–374
397
417
432
443–444
452
458–459
20
319
349
375
398
418–419
433–434
445
453–454
460
21
320
350
376
399
420
435
446
455
461–462
22
320
351
377
400
421–422
436
447
456–457
463
23
321
351
378
401–402
423
437–438
448–449
458–459
464
24
322
352
379
403
424
439
450
460
465–466
25
322
353
380
404
425
440
451
461
467
26
323
354
381
405
426
441
452
462
468
27
324
355
382
406
427–428
442
453–454
463
469
28
324
356
382
406
429
443
455
464
470–471
29
325
357
383
407
430
444
456
465
472
30
326
358
384
408
431
445
457
466–467
473
31
326
359
385
409
432
446
458
468
474
32
327
360
386
410
432
447
459
469
475
33
328
361
387
411
433
448
460
470
476–477
34
329
362
388
412
434
449
461
471
478
35
329
363
389
412
435
450
462
472
479–480
36
330
363
390
413
435
451
463
473
481
37
330
364
391
414
436
452
464
474
482
38
331
365
392
415
437
453
465
475
483
39
332
366
392
416
438
454
466
476–477
483
40
332
366
393
417
438
455
466
478
484
41
333
367
394
417
439
455
467
479
485–486
42
334
368
395
418
440
456
468
480
487
43
334
368
395
419
440
457
469
481
488
44
335
369
396
420
441
458
470
482
489
45
336
369
396
421
442
459
471
483
490
46
336
370
397
422
442
460
472
484
491
47
337
371
398
422
443
460
472
484
492
48
337
371
398
423
444
461
473
485
493
49
338
372
399
424
445
462
474
486
494
iReady Scores Percentile
Grade K
Grade 1
Grade 2
Grade 3
Grade 4
Grade 5
Grade 6
Grade 7
Grade 8
50
339
372
399
424
445
463
475
487
495
51
339
373
400
425
446
463
476
488
496
52
340
374
400
426
447
464
477
489
497
53
340
374
401
426
447
465
478
490
497
54
341
375
402
427
448
465
479
491
498
55
341
375
402
428
448
466
480
492
499
56
342
376
403
429
449
467
481
493
500
57
343
376
403
430
450
468
482
494
500
58
343
377
404
430
451
469
483
495
501
59
344
378
405
431
452
469
483
496
502
60
344
378
405
432
452
470
484
496
503
61
345
379
406
432
453
471
484
497
503
62
345
379
406
433
454
471
485
498
504
63
346
380
407
433
455
472
486
499
505
64
347
381
407
434
455
472
487–488
499
506–507
65
347
381
408
435
456
473
489
500
508
66
348
381
408
435
457
473
490
501
509
67
348
382
409
436
457
474
490
501
510
68
349
382
409
436
458
474
491
502
511
69
349
383
410
437
459
475
492
503
512
70
350
384
411
437
460
476
493
503
513
71
350
384
411
438
460
477
494
504
513
72
351
385
412
439
461
478
495
505
514
73
352
386
413
439
462
479
496
506
514
74
352
387
414
440
462
480
496
507
515
75
353
387
414
440
463
481
497
508–509
516
76
354
388
415
441
464
482
498
510
517
77
354
389
416
442
464
483
499
511
518–519
78
355
390
417
442
465
483
500
511
520–521
79
356
391
418
443
466
484
501
512
522
80
357
392
419–420
444
467
485
501
513
523
81
358
393
421
445
468
485–486
502
513
524–525
82
359
394
421
445
469
487
503
514
526–527
83
360
394
422
446
469
488
504
515
528–529
84
361
395
423
447
470
489–490
505
516
530
85
362
396
424–425
448
471
491
506–507
517
531–532
86
363
397
426
449
472
492
508–509
518–519
533–534
87
364
398–399
427
450
473
493–494
510
520–521
535
88
365–366
400
428
451
474
495
511
522–523
536–537
89
367
401
429–430
452–453
475–476
496
512
524–525
538–540
90
368
402–403
431
454
477–478
497–498
513
526–528
541–542
91
369–370
404
432
455
479
499–500
513
529–530
543–545
92
371
405–406
433
456
480–481
501
514
531–532
546–547
93
372–373
407–408
434–435
457
482–483
502–503
515–517
533–534
548–550
94
374–375
409–410
436–437
458–459
484–485
504–507
518–520
535–537
551–553
95
376–377
411–412
438–439
460–462
486–488
508–511
521–524
538–542
554–555
96
378–380
413–417
440–441
463–464
489–491
512–514
525–530
543–546
556–558
97
381–383
418–422
442–445
465–468
492–495
515–517
531–535
547–551
559–564
98
384–390
423–428
446–451
469–474
496–502
518–522
536–542
552–557
565–572
99
391–800
429–800
452–800
475–800
503–800
523–800
543–800
558–800
573–800
These norms are based on Diagnostic data from the 2022–2023 school year and apply to the 2024–2025 school year. By finding a student’s scale score in the table, families and educators can see where that score falls among a nationally representative sample of students. A percentile indicates the percentage of students nationwide whose scores a given student’s performance meets or exceeds. For instance, a student at the 75th percentile scored as well or better than 75% of students in the same grade who took the i-Ready Diagnostic during the specified window.
Winter 2024-2025 – i-Ready Diagnostic Scores By Grade in Math (Percentiles).
This table shows the Winter i-Ready Diagnostic for Mathematics percentile-to-score conversion ranges by grade level for Diagnostics taken between November 16 and March 1. The analyses were based on the 2022–2023 academic year, and the data officially applies to the 2024-2025 school year. Each percentile indicates the proportion of students nationwide whose scores fall at or below a given range for their grade level.
iReady Scores Percentile
Grade K
Grade 1
Grade 2
Grade 3
Grade 4
Grade 5
Grade 6
Grade 7
Grade 8
1
100–302
100–319
100–339
100–355
100–369
100–380
100–387
100–393
100–398
2
303–307
320–328
340–348
356–365
370–380
381–393
388–400
394–406
399–411
3
308–310
329–334
349–354
366–372
381–388
394–400
401–408
407–414
412–419
4
311–313
335–339
355–359
373–377
389–393
401–406
409–414
415–420
420–425
5
314–315
340–343
360–363
378–381
394–398
407–411
415–419
421–425
426–431
6
316–318
344–346
364–367
382–386
399–402
412–415
420–423
426–429
432–435
7
319–320
347–348
368–369
387–389
403–405
416–419
424–427
430–433
436–438
8
321
349–350
370–372
390–392
406–408
420–421
428–430
434–436
439–441
9
322–323
351–352
373–374
393–395
409–411
422–424
431–432
437–438
442–444
10
324
353–354
375–376
396–397
412–414
425–426
433–435
439–441
445–446
11
325–326
355–356
377–378
398–399
415–416
427–429
436–437
442–443
447–449
12
327
357–358
379–380
400–401
417–419
430–431
438–439
444–445
450–451
13
328–329
359
381
402–403
420–421
432
440–441
446–447
452–453
14
330
360–361
382–383
404
422
433–434
442–443
448–449
454–456
15
331
362
384–385
405–406
423–424
435–436
444
450–451
457–458
16
332–333
363
386
407–408
425
437–438
445–446
452–453
459
17
334
364–365
387–388
409
426–427
439
447–448
454–455
460–461
18
335
366
389
410–411
428–429
440–441
449
456
462–463
19
336
367
390–391
412
430
442
450–451
457–458
464
20
337
368
392
413–414
431
443
452
459–460
465–466
21
338
369
393
415
432
444–445
453–454
461
467–468
22
339
370
394
416
433
446
455
462
469
23
340
371
395
417–418
434
447
456–457
463–464
470
24
341
371
396
419
435
448
458
465
471–472
25
341
372
396
420
436
449
459–460
466
473
26
342
373
397
421
437
450–451
461
467–468
474–475
27
343
374
398
422
438
452
462
469
476
28
344
375
399
423
439
453
463
470
477–478
29
344
375
400
424
440
454
464
471
479
30
345
376
400
424
441
455
465
472
480–481
31
346
377
401
425
442
456
466
473–474
482
32
347
378
402
426
443
457
467
475
483
33
347
378
403
427
444
458
468
476
484
34
348
379
403
428
445
459
469
477–478
485
35
348
380
404
429
446
460
470
479
486–487
36
349
380
405
430
446
461
471
480
488
37
350
381
405
431
447
462
472
481
489
38
350
382
406
431
448
462
473
482
490
39
351
382
407
432
449
463
474
483
491
40
351
383
407
433
450
464
475
484
492
41
352
384
408
433
450
465
476
485
493
42
353
385
408
434
451
466
477
486–487
494
43
353
385
409
435
452
466
478–479
488
495
44
354
386
410
435
453
467
480
489
496
45
354
387
411
436
454
468
481
490
497
46
355
388
411
436
454
469
482
491
498
47
356
388
412
437
455
470
482
492
499
48
356
389
413
438
456
470
483
493
500
49
357
390
413
438
457
471
484
494
500
iReady Scores Percentile
Grade K
Grade 1
Grade 2
Grade 3
Grade 4
Grade 5
Grade 6
Grade 7
Grade 8
50
358
390
414
439
457
472
484
495
501
51
359
391
415
439
458
472
485–486
496
502
52
359
392
415
440
459
473
487
496
502
53
360
392
416
441
460
473
488
497
503
54
361
393
417
441
461
474
489
498
504
55
361
393
418
442
461
475
490
499
505
56
362
394
418
442
462
476
490
500
506
57
362
394
419
443
462
476
491
500
507–508
58
363
395
420
444
463
477
492
501
509
59
364
396
421
444
464
478
493
502
510
60
364
396
421
445
464
479
494
502
511
61
365
397
422
446
465
480
495
503
512
62
366
397
423
446
465
481
496
504
512
63
366
398
423
447
466
482
496
504
513
64
367
399
424
447
467
482
497
505
514
65
368
399
425
448
468
483
498
506
514
66
368
400
425
448
468
483
499
507–508
515
67
369
400
426
449
469
484
500
509
516
68
369
401
426
450
469
485
500
510
517
69
370
402
427
451
470
485–486
501
511
518–519
70
371
402
428
451
471
487
502
511
520
71
371
403
429
452
471
488
502
512
521
72
372
404
430
453
472
489
503
513
522
73
372
405
431
453
473
490
504
513
523
74
373
405
431
454
473
491
504
514
524–525
75
374
406
432
454
474
492
505–506
514
526
76
374
407
433
455
474
493
507
515
527–528
77
375
407
433
456
475
494
508
516
529–530
78
375
408
434
456
476
495
509
517–518
531
79
376
409
434
457
477
496
510
519–520
532
80
377
410
435
458
478–479
497
511
521
533–534
81
378
411
436
458
480
498
512
522
535
82
378
412
437
459
481
499
512
523–524
536–537
83
379
413
438
460
482
500
513
525
538–539
84
380
414
439
461
483
501
514
526–528
540
85
380
415–416
439
462
483
502
514
529
541–542
86
381
417
440
463
484–485
503
515
530–531
543–544
87
382
418–419
441
464
486
504
516–517
532–533
545–546
88
383–384
420
442
464
487–488
505–507
518–519
534
547–548
89
385
421–422
443
465
489
508–509
520–521
535–536
549–550
90
386–387
423
444
466
490–491
510–511
522–524
537–539
551–552
91
388
424–425
445
467–468
492
512
525–527
540–541
553
92
389–390
426–427
446–447
469
493–494
513
528–530
542–544
554–555
93
391–392
428
448
470–471
495–496
514–515
531–533
545–546
556–557
94
393–394
429–430
449–451
472–473
497–499
516
534–535
547–549
558–560
95
395–397
431
452–453
474–475
500–501
517–519
536–539
550–552
561–564
96
398–400
432–434
454–455
476–480
502–506
520–522
540–543
553–555
565–568
97
401–404
435–438
456–458
481–485
507–512
523–529
544–548
556–560
569–573
98
405–410
439–442
459–463
486–492
513–518
530–535
549–554
561–567
574–580
99
411–800
443–800
464–800
493–800
519–800
536–800
555–800
568–800
581–800
Spring 2024-2025 – i-Ready Diagnostic Scores By Grade in Math (Percentiles).
Below is Table 1, which shows the Spring i-Ready Diagnostic for Mathematics percentile-to-score conversion ranges by grade level for Diagnostics taken between March 2 and the end of the school year. The analyses were based on the 2022–2023 academic year. Each percentile indicates how a student’s scaled score compares to a nationally representative sample of students in the same grade during this spring testing window.
i-Ready Scores Percentile
Grade K
Grade 1
Grade 2
Grade 3
Grade 4
Grade 5
Grade 6
Grade 7
Grade 8
1
100–308
100–328
100–347
100–360
100–372
100–384
100–390
100–394
100–398
2
309–315
329–339
348–356
361–370
373–384
385–396
391–403
395–408
399–411
3
316–320
340–345
357–363
371–378
385–392
397–404
404–411
409–416
412–420
4
321–323
346–349
364–368
379–384
393–398
405–410
412–417
417–423
421–426
5
324–327
350–353
369–372
385–389
399–403
411–415
418–422
424–428
427–432
6
328–330
354–356
373–375
390–393
404–408
416–419
423–426
429–432
433–436
7
331–332
357–359
376–378
394–396
409–412
420–423
427–430
433–436
437–439
8
333–335
360–361
379–381
397–399
413–415
424–425
431–433
437–439
440–442
9
336–337
362–364
382–384
400–402
416–418
426–429
434–436
440–441
443–445
10
338–339
365–366
385–387
403–405
419–421
430–431
437–438
442–444
446–448
11
340–341
367–368
388–389
406–407
422–423
432–434
439–440
445–446
449–451
12
342
369
390–391
408–410
424–425
435–436
441–442
447–448
452–453
13
343–344
370
392–393
411–412
426–427
437–438
443–444
449–450
454–456
14
345
371–372
394
413–414
428–429
439–440
445–446
451–452
457–458
15
346
373
395–396
415–416
430–431
441
447–448
453–454
459–460
16
347
374
397
417–418
432–433
442–443
449–450
455–457
461–462
17
348
375–376
398
419–420
434
444
451–452
458–459
463
18
349
377
399
421
435–436
445–446
453–454
460
464–465
19
350
378
401
422–423
437
447
455–456
461–462
466–467
20
351
379
402
424
438–439
448–449
457–458
463
468–469
21
352
380
403
425
440
450
459
464
470
22
353
381–382
404
426–427
441
451–452
460
465–466
471–472
23
354
383
405
428
442–443
453
461–462
467
473
24
355
384
406
429
444
454–455
463
468–469
474–475
25
356
385
407
430
445
456
464
470
476–477
26
357
386
408
431
446
457–458
465–466
471
478–479
27
358
387
409
432
447
459
467
472–473
480
28
359
388
410
433
448
460
468
474
481–482
29
360
389
411
434
449–450
461
469
475–476
483
30
361
390
412
435
451
462
470
477
484
31
362
391
413
436
452
463
471–472
478–479
485–486
32
362
392
414
437
453
464
473
480
487
33
363
393
415
437
454
465
474
481–482
488–489
34
364
394
416
438
455
466
475
483
490
35
365
395
417
439
456
467
476
484
491
36
365
395
418
440
457
468
477–478
485
492
37
366
396
418
440
458
469
479
486–487
493
38
367
397
419
441
459
470
480–481
488
494
39
368
397
420
442
460
471
482
489
495
40
368
398
421
442
461
472
482
490
496
41
369
399
422
443
462
472
483
491
497
42
369
399
422
444
463
473
484
492–493
498
43
370
400
423
445
464
474
485
494
499
44
370
400
424
446
464
475
486–487
495
500
45
371
401
425
446
465
476
488
496
501
46
372
401
425
447
466
477
489
496
501
47
372
402
426
448
467
478–479
490
497
502
48
373
403
427
448
468
480
491
498
503
49
373
403
428
449
469
481
492
499
504
This table displays the scaled score ranges associated with percentiles 1–99 for Grades K–8.
These Spring norms are based on Diagnostic data from the 2022–2023 academic year, and they apply to the 2024-2025 school year. By locating a student’s overall i-Ready Mathematics scale score in the table, educators and families can see where that score stands relative to a nationwide sample of students at the same grade level during the spring testing season. The percentile indicates the percentage of students at or below that performance level—for example, a score at the 30th percentile means the student performed as well or better than 30% of students in that grade who took the test in the spring.
iReady Scores Percentile
Grade K
Grade 1
Grade 2
Grade 3
Grade 4
Grade 5
Grade 6
Grade 7
Grade 8
50
374
404
428
450
469
482
493
500
505
51
374
404
429
451
470
482
494
501
506
52
375
405
430
452
471
483
495
501
507–508
53
375
406
431
453
471
483
496
502
509
54
376
406
432
453
472
484
497
503
510
55
376
407
432
454
472
485
498
504
511
56
377
407
433
455
473
486
498
505
512
57
377
408
434
456
473
487
499
506
513
58
378
409
434
456
474
488
500
507
514
59
378
409
435
457
474
489
501
508–509
514
60
379
410
435
458
475
490
501
510
515
61
379
411
436
459
476
491
502
511
516
62
380
411
436
460
477
492
503
511
517
63
380
412
437
461
478
493
503
512
518–519
64
381
413
437
461
479
494
504
513
520
65
382
413
438
462
480
495
505
513
521
66
382
414
439
462
481
496
506
514
522
67
383
415
439
463
481
497
506–507
515
523
68
384
416
440
644
482
497
508
515
524–525
69
384
417
440
464
483
498
509
516
526
70
385
417
441
465
483
499
510
517
527–528
71
386
418
441
465
484
500
511
518
529
72
387
419
442
466
485
501
512
519–520
530
73
388
420
442
467
486
502
512
521
531–532
74
388
421
443
468
487
503
513
522
533
75
389
422
443
469
488
503
513
523–524
534
76
390
423
444
469
489
504
514
525
535–536
77
391
423
445
470
490–491
505–506
515
526–527
537
78
392
424
445
471
492
507
515
528
538–539
79
393
425
446
471
493
508
516–517
529–530
540
80
394
426
447
472
494
509–510
518–519
531–532
541
81
395
427
447
473
495
511
520–521
533
542–543
82
396
428
448
473
496
512
522
534–535
544–545
83
397
429
449
474
497
512
523–524
536
546
84
398
430
450
475–476
498
513
525–526
537–538
547–548
85
399
430
451
477–478
499
514
527–529
539–540
549–550
86
400
431
452
479
500–501
515
530–531
541–542
551
87
401
432
453
480–481
502
515
532
543–544
552–553
88
402
433
454
482
503–504
516–517
533–534
545–546
554–555
89
403
434
455
483
505–507
518
535–537
547–548
556–557
90
404–405
435
456
484–485
508–510
519–520
538–540
549–550
558–559
91
406–407
436–437
457
486–487
511–512
521–522
541–542
551–552
560–562
92
408
438–439
458–459
488–489
513–515
523–526
543–544
553–554
563–565
93
409–410
440–441
460–461
490–491
516
527–529
545–547
555–556
566–568
94
411–412
442
462–463
492–494
517–518
530–532
548–549
557–559
569–571
95
413–415
443–445
464
495–497
519–520
533–535
550–552
560–563
572–574
96
416–418
446–447
465–467
498–500
521–522
536–537
553–555
564–567
575–578
97
419–423
448–451
468–472
501–506
523–526
538–541
556–559
568–572
579–583
98
424–429
452–455
473–478
507–513
527–530
542–548
560–565
573–579
584–590
99
430–800
456–800
479–800
514–800
531–800
549–800
566–800
580–800
591–800
These Spring norms are based on Diagnostic data from the 2022–2023 academic year, and they apply to the 2024-2025 school year. By locating a student’s overall i-Ready Mathematics scale score in the table, educators and families can see where that score stands relative to a nationwide sample of students at the same grade level during the spring testing season.
The percentile indicates the percentage of students at or below that performance level—for example, a score at the 30th percentile means the student performed as well as or better than 30% of students in that grade who took the test in the spring.
Example Chart (for sharing):
iready diagnostic score by grade math 2025 2024 percentiles