
NWEA MAP Scores by Grade Level 2024-2025 (MAP Test Scores Chart 2025)
NWEA MAP Test Scores by Grade Level (2024-2025).
NWEA MAP Test Scores by Grade Level (Charts) for Kindergarten Through 10th Grade.
As a parent, understanding your child’s academic progress is essential. The NWEA MAP Test is a widely used assessment that helps measure student growth and proficiency in subjects like Math, Reading, and Language. Whether your child is in Kindergarten, 1st grade, 2nd grade, or up to 10th grade, their MAP scores provide valuable insight into their learning journey.
Where to Find Official MAP Test Scores.
For the latest NWEA MAP scores by grade level for the 2024-2025 school year (and soon 2026), use our website at SchoolTest.org, your trusted source for up-to-date standardized test data. Use the ‘Search’ function for more articles about NWEA MAP Test scores for the Fall, Winter and Spring Semesters, or read on in the article below. The charts below were created by our NWEA Expert David Smith. You can email him at: Email: [email protected], if you have questions about the charts.
Quick Links:
NWEA MAP scores by grade level 2024-2025 – Percentiles.
NWEA MAP scores by grade level 2024-2025 – Fall, Winter and Spring.
NWEA MAP scores by grade level 2024-2025
In addition to MAP scores, SchoolTest.org provides official score reports for other important assessments, including i-Ready Diagnostic, SAT, and ACT. With verified and regularly updated data, parents can stay informed about their child’s academic performance and how it compares nationally.
What is the NWEA MAP Test?
The NWEA Measures of Academic Progress (MAP) Test is a computer-adaptive test used by schools to assess student learning and track academic growth over time. Unlike traditional standardized tests, MAP adjusts the difficulty of questions based on a student’s responses, ensuring a personalized assessment of their skills.
How is the MAP Test Scored?
MAP scores use the RIT (Rasch Unit) scale, which measures a child’s academic ability independently of their grade level. Here’s what makes the MAP scoring system unique:
- No pass or fail – Scores reflect where a student is in their learning journey.
- Scaled score – Performance is measured on a continuous scale, allowing for accurate growth tracking.
- Higher RIT scores indicate a higher level of academic achievement.
- Progress matters most – Educators use these scores to monitor growth rather than focusing on a single result.
When is the MAP Test Given?
Most schools administer the MAP Test three times a year:
- Fall (Beginning of the Year): Establishes a starting point.
- Winter (Mid-Year): Measures growth and identifies learning needs.
- Spring (End of the Year): Evaluates overall progress and readiness for the next grade.
Some schools may also offer a summer session to assess learning retention.
What is a Good MAP Score?
A “good” score varies by grade level, subject, and student progress. However, here’s a general breakdown:
- Above the 75th percentile – Excellent performance (top students).
- 50th-75th percentile – Above average.
- 40th-50th percentile – Average.
- Below the 40th percentile – May indicate the need for additional support.
It’s important to focus on growth over time, not just one score. If your child is making steady progress, they are on the right path!
NWEA MAP Test Scores Chart (2025) by Grade Level – Fall Norms.
To help parents understand MAP scores, we provide a grade-level chart that includes Math, Reading, and Language score averages, along with national percentile rankings.
Refer to the NWEA MAP Test Score Chart 2025 below to get a better understand on how your child has scored. We have also added NWEA Map Test percentile ranges for the Fall, Winter and Spring tests, on our MAP Test Scores Percentiles Chart 2024-2025 (Fall, Winter, Spring) page.
Kindergarten NWEA MAP Test Scores (Fall 2025)
| Achievement Level | Mathematics | Reading | Language Usage | Percentile |
|---|---|---|---|---|
| Higher Achievement | 160 | 157 | – | 95 |
| Higher Achievement | 152 | 149 | – | 84 |
| Higher Achievement | 146 | 143 | – | 69 |
| Median and Mean | 140 | 137 | – | 50 |
| Lower Achievement | 133 | 131 | – | 31 |
| Lower Achievement | 127 | 124 | – | 16 |
| Lower Achievement | 119 | 117 | – | 5 |
1st Grade NWEA MAP Test Scores (Fall 2025)
| Achievement Level | Mathematics | Reading | Language Usage | Percentile |
|---|---|---|---|---|
| Higher Achievement | 181 | 177 | – | 95 |
| Higher Achievement | 172 | 169 | – | 84 |
| Higher Achievement | 166 | 162 | – | 69 |
| Median and Mean | 160 | 156 | – | 50 |
| Lower Achievement | 154 | 150 | – | 31 |
| Lower Achievement | 148 | 143 | – | 16 |
| Lower Achievement | 140 | 135 | – | 5 |
2nd Grade NWEA MAP Test Scores (Fall 2025)
| Achievement Level | Mathematics | Reading | Language Usage | Percentile |
|---|---|---|---|---|
| Higher Achievement | 196 | 197 | 200 | 95 |
| Higher Achievement | 188 | 187 | 190 | 84 |
| Higher Achievement | 181 | 180 | 182 | 69 |
| Median and Mean | 175 | 172 | 174 | 50 |
| Lower Achievement | 169 | 165 | 166 | 31 |
| Lower Achievement | 162 | 157 | 158 | 16 |
| Lower Achievement | 154 | 147 | 148 | 5 |
3rd Grade NWEA MAP Test Scores (Fall 2025)
| Achievement Level | Mathematics | Reading | Language Usage | Percentile |
|---|---|---|---|---|
| Higher Achievement | 210 | 210 | 210 | 95 |
| Higher Achievement | 202 | 201 | 200 | 84 |
| Higher Achievement | 195 | 193 | 192 | 69 |
| Median and Mean | 188 | 185 | 184 | 50 |
| Lower Achievement | 180 | 177 | 176 | 31 |
| Lower Achievement | 173 | 170 | 168 | 16 |
| Lower Achievement | 165 | 162 | 160 | 5 |
4th Grade NWEA MAP Test Scores (Fall 2025)
| Achievement Level | Mathematics | Reading | Language Usage | Percentile |
|---|---|---|---|---|
| Higher Achievement | 220 | 220 | 220 | 95 |
| Higher Achievement | 212 | 211 | 210 | 84 |
| Higher Achievement | 204 | 203 | 202 | 69 |
| Median and Mean | 196 | 195 | 194 | 50 |
| Lower Achievement | 188 | 187 | 186 | 31 |
| Lower Achievement | 180 | 179 | 178 | 16 |
| Lower Achievement | 172 | 171 | 170 | 5 |
5th Grade NWEA MAP Test Scores (Fall 2025)
| Achievement Level | Mathematics | Reading | Language Usage | Percentile |
|---|---|---|---|---|
| Higher Achievement | 230 | 230 | 230 | 95 |
| Higher Achievement | 222 | 221 | 220 | 84 |
| Higher Achievement | 214 | 213 | 212 | 69 |
| Median and Mean | 206 | 205 | 204 | 50 |
| Lower Achievement | 198 | 197 | 196 | 31 |
| Lower Achievement | 190 | 189 | 188 | 16 |
| Lower Achievement | 182 | 181 | 180 | 5 |
6th Grade NWEA MAP Test Scores (Fall 2025)
| Achievement Level | Mathematics | Reading | Language Usage | Percentile |
|---|---|---|---|---|
| Higher Achievement | 240 | 240 | 240 | 95 |
| Higher Achievement | 232 | 231 | 230 | 84 |
| Higher Achievement | 224 | 223 | 222 | 69 |
| Median and Mean | 216 | 215 | 214 | 50 |
| Lower Achievement | 208 | 207 | 206 | 31 |
| Lower Achievement | 200 | 199 | 198 | 16 |
| Lower Achievement | 192 | 191 | 190 | 5 |
7th Grade NWEA MAP Test Scores (Fall 2025)
| Achievement Level | Mathematics | Reading | Language Usage | Percentile |
|---|---|---|---|---|
| Higher Achievement | 250 | 250 | 250 | 95 |
| Higher Achievement | 242 | 241 | 240 | 84 |
| Higher Achievement | 234 | 233 | 232 | 69 |
| Median and Mean | 226 | 225 | 224 | 50 |
| Lower Achievement | 218 | 217 | 216 | 31 |
| Lower Achievement | 210 | 209 | 208 | 16 |
| Lower Achievement | 202 | 201 | 200 | 5 |
8th Grade NWEA MAP Test Scores (Fall 2025)
| Achievement Level | Mathematics | Reading | Language Usage | Percentile |
|---|---|---|---|---|
| Higher Achievement | 260 | 260 | 260 | 95 |
| Higher Achievement | 252 | 251 | 250 | 84 |
| Higher Achievement | 244 | 243 | 242 | 69 |
| Median and Mean | 236 | 235 | 234 | 50 |
| Lower Achievement | 228 | 227 | 226 | 31 |
| Lower Achievement | 220 | 219 | 218 | 16 |
| Lower Achievement | 212 | 211 | 210 | 5 |
9th Grade NWEA MAP Test Scores (Fall 2025)
| Achievement Level | Mathematics | Reading | Language Usage | Percentile |
|---|---|---|---|---|
| Higher Achievement | 270 | 270 | 270 | 95 |
| Higher Achievement | 262 | 261 | 260 | 84 |
| Higher Achievement | 254 | 253 | 252 | 69 |
| Median and Mean | 246 | 245 | 244 | 50 |
| Lower Achievement | 238 | 237 | 236 | 31 |
| Lower Achievement | 230 | 229 | 228 | 16 |
| Lower Achievement | 222 | 221 | 220 | 5 |
10th Grade NWEA MAP Test Scores (Fall 2025)
| Achievement Level | Mathematics | Reading | Language Usage | Percentile |
|---|---|---|---|---|
| Higher Achievement | 280 | 280 | 280 | 95 |
| Higher Achievement | 272 | 271 | 270 | 84 |
| Higher Achievement | 264 | 263 | 262 | 69 |
| Median and Mean | 256 | 255 | 254 | 50 |
| Lower Achievement | 248 | 247 | 246 | 31 |
| Lower Achievement | 240 | 239 | 238 | 16 |
| Lower Achievement | 232 | 231 | 230 | 5 |
11th Grade NWEA MAP Test Scores (Fall 2025)
| Achievement Level | Mathematics | Reading | Language Usage | Percentile |
|---|---|---|---|---|
| Higher Achievement | 290 | 290 | 290 | 95 |
| Higher Achievement | 282 | 281 | 280 | 84 |
| Higher Achievement | 274 | 273 | 272 | 69 |
| Median and Mean | 266 | 265 | 264 | 50 |
| Lower Achievement | 258 | 257 | 256 | 31 |
| Lower Achievement | 250 | 249 | 248 | 16 |
| Lower Achievement | 242 | 241 | 240 | 5 |
12th Grade NWEA MAP Test Scores (Fall 2025)
| Achievement Level | Mathematics | Reading | Language Usage | Percentile |
|---|---|---|---|---|
| Higher Achievement | 300 | 300 | 300 | 95 |
| Higher Achievement | 292 | 291 | 290 | 84 |
| Higher Achievement | 284 | 283 | 282 | 69 |
| Median and Mean | 276 | 275 | 274 | 50 |
| Lower Achievement | 268 | 267 | 266 | 31 |
| Lower Achievement | 260 | 259 | 258 | 16 |
| Lower Achievement | 252 | 251 | 250 | 5 |
This chart provides a snapshot of where students typically fall at the beginning of the academic year (FALL Semester). Scores may vary depending on district standards and student demographics.
How to Understand Your Child’s NWEA MAP Scores
As a parent, you want to know how your child is progressing academically. The NWEA MAP Test helps measure your child’s growth in subjects like Math, Reading, and Language Usage, but understanding the scores can feel overwhelming. This guide breaks down MAP scores in a way that’s easy to understand, so you can support your child’s learning effectively.
What Do MAP Scores Mean?
MAP scores provide two important pieces of information:
1. Percentile Rankings (How Your Child Compares to Other Students)
Percentile rankings show how your child’s score compares to other students nationwide in the same grade.
- 50th percentile – Your child scored better than 50% of students (average performance).
- 95th percentile – Your child outperformed 95% of students (exceptional performance).
2. RIT Scores (Your Child’s Academic Level & Growth)
RIT (Rasch Unit) scores measure your child’s academic ability on a continuous scale, meaning they are not tied to a specific grade level. The higher the RIT score, the more advanced your child’s skills in that subject.
For example:
- A 3rd grader with a RIT score of 190 in math is at an average level, while a score of 230 suggests advanced proficiency.
- An 8th grader with a RIT score of 220 is at an average level, while higher scores indicate above-grade-level ability.
The most important thing to watch is growth over time rather than just a single score.
How to Read Your Child’s MAP Score Report
Your child’s MAP test results include a graph and table to track their academic progress over time. Here’s how to interpret these sections:
Understanding the Score Graph
The score graph shows:
- Testing periods (Fall, Winter, Spring) on the horizontal axis (left to right).
- RIT scores on the vertical axis (up and down).
- Several colored lines that help compare your child’s progress:
- Blue solid line: Your child’s actual MAP scores over time.
- Orange solid line: The district average for students in the same grade.
- Yellow solid line: The national average (how students across the country perform).
- Blue dotted line: A projection of your child’s expected growth.
What This Means for Your Child
If your child’s scores increase steadily, they are making good progress. If their growth slows or drops, they may need extra support.
Example:
- A Fall RIT score of 190 in math with a projected Spring score of 200 sets an expected growth path.
- If your child scores 205 in Spring, they are exceeding expectations!
- If they score 195, they may need extra help in math.
How to Use the Student Progress Table
The Student Progress Table (on the right side of the report) helps parents see how much their child is growing. Here’s what each column means:
- Testing Term – Shows when your child took the MAP test (e.g., Fall 2023, Winter 2024).
- RIT Score (+/- Standard Error) – Your child’s actual RIT score and a small range where they might score on a retake.
- Percentile Range – Shows your child’s ranking compared to other students nationwide.
- RIT Growth – Measures how much your child’s score improved since the last test. A positive number (+10) means progress, while no growth (0) may signal a learning gap.
- Growth Projection – The average expected growth for students with similar scores.
- Projected RIT – A prediction of your child’s future score.
Example Interpretation
If your child had a Fall RIT score of 200 and was expected to grow to 210 in the Winter but actually scored 215, that means they are progressing faster than expected. If they scored 205, they may need extra support to meet growth expectations.
How to Use MAP Scores to Support Your Child
MAP reports don’t just show scores—they help parents identify strengths and areas for improvement. Here’s how you can use this information:
1. Focus on Growth, Not Just Scores
- Even if your child isn’t in the top percentile, steady growth is a good sign.
- If growth slows, talk to their teacher about ways to help at home.
2. Support Subject-Specific Learning
The report breaks down skills in each subject, so you can focus on areas where your child needs improvement. For example:
- Math: Algebra, geometry, data analysis, and number systems.
- Reading: Vocabulary, literature comprehension, and informational texts.
- Language Usage: Grammar, punctuation, and writing strategies.
3. Select Books at the Right Reading Level
The Lexile Range in the reading section suggests the difficulty of books your child can understand. If their Lexile range is 800L–1000L, they should read books in this range to improve comprehension.
4. Set Realistic Goals & Track Progress
- If your child’s goal is to grow 10 RIT points, help them break it into smaller steps.
- Celebrate small improvements, like moving from the 40th to the 50th percentile!
Helping Your Child Succeed on the MAP Test
1. Reduce Test Anxiety. Testing can lead to Test Anxiety. You can reduce your child’s anxiety by:
- Explain that the test isn’t about passing or failing—it just helps teachers understand how they learn.
- Encourage deep breathing or stretching before tests.
- Ensure they get enough sleep and eat a healthy breakfast on test days.
2. Keep Learning Fun & Engaging
- Use educational games, apps, and real-life activities (like measuring in the kitchen or reading signs while driving) to reinforce learning.
- Balance study time with breaks and fun activities to prevent burnout.
3. Encourage a Growth Mindset
- Praise effort, not just results (e.g., “I love how you kept trying even when the problem was hard!”).
- Teach them to see mistakes as learning opportunities rather than failures.
Understanding MAP Test Scores: Help Your Child to Reach Their Full Potential.
As a parent, you want to know how your child is progressing in school and where they might need extra support. The NWEA MAP Growth Test is a unique assessment that helps measure student performance in math, reading, and language usage—but unlike traditional tests, it adapts to your child’s skill level.
This means that every test is personalized, giving parents and teachers a clear picture of what their child knows and where they can improve.
How the MAP Test Works
The MAP test adjusts in real time based on your child’s answers:
- Correct answers lead to more challenging questions.
- Incorrect answers prompt easier questions.
This adaptive method ensures that your child is always being tested at the right level—helping to pinpoint their strengths and identify areas where they may need more support.
At the start of the test, a few calibration questions help determine your child’s starting point. These questions are important because they set the stage for how the test adapts throughout the session.
Understanding MAP Scores: What is a RIT Score?
The RIT (Rasch Unit) score is a key part of your child’s MAP test results. Unlike regular test scores that compare students only within their grade, the RIT score measures actual academic ability, no matter their age or grade level.
Here’s what makes RIT scores unique and useful:
✅ Equal-interval scale – A RIT score works like a growth chart, showing progress year after year.
✅ No pass/fail system – The goal is to track improvement, not just get a high score.
✅ Personalized benchmarks – Educators use RIT scores to set realistic learning goals based on a child’s individual progress.
A RIT score tells us the difficulty level of questions a student can answer correctly about 50% of the time. This balance ensures that the test accurately measures what they know now and what they’re ready to learn next.
How MAP Scores Help Guide Learning
Because MAP Growth tracks progress over time, it helps parents and teachers:
📌 Set achievable goals based on individual strengths and learning needs.
📌 Monitor year-over-year growth, ensuring students continue improving at their own pace.
📌 Identify areas needing extra support to focus learning efforts where they matter most.
By understanding your child’s MAP scores, you can work together with their teachers to:
- Encourage strengths in subjects where they excel.
- Provide extra help in areas where they struggle.
Remember: MAP Scores Are a Tool, Not a Label.
Your child’s MAP test results are not about passing or failing—they are a tool for growth. They show where your child is today and help guide them toward where they need to be.
By understanding how the MAP test works and what RIT scores mean, you can better support your child’s education and help them reach their full potential.
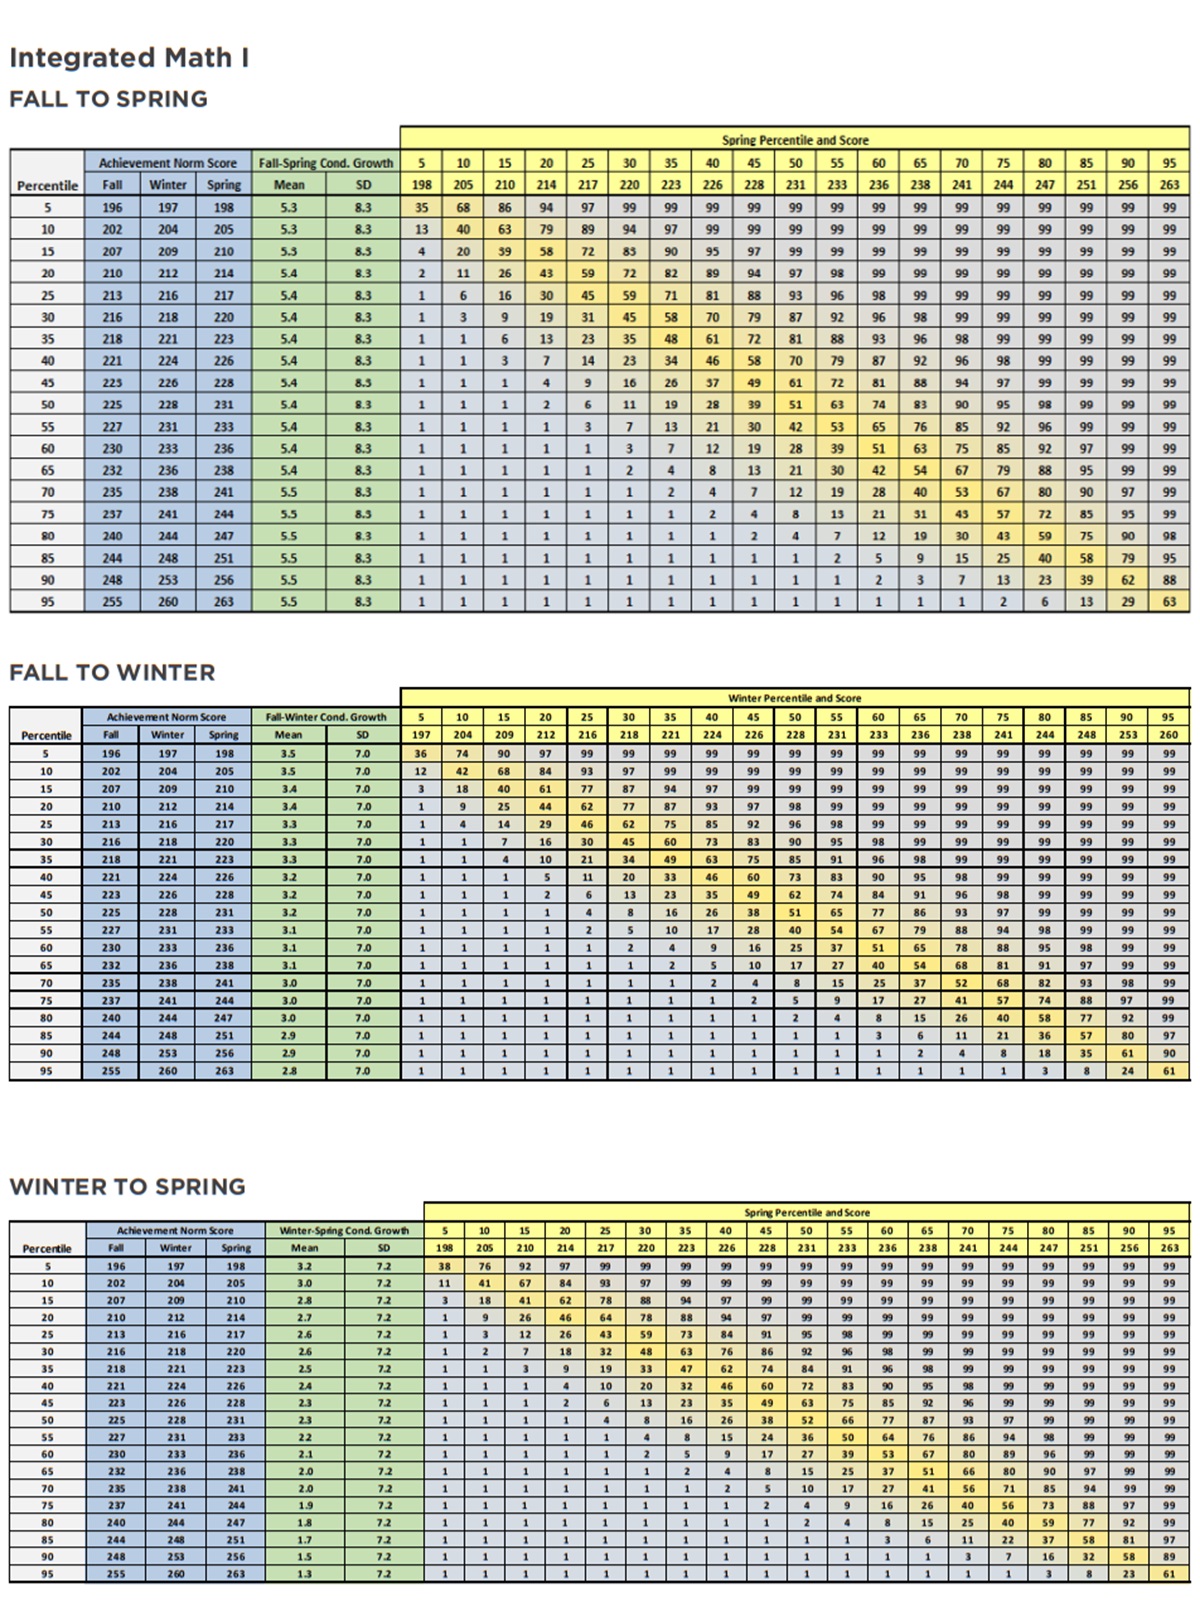
NWEA Map Scores: Integrated Math I Course-Specific Norms (2022).
NWEA created special MAP Growth tests for subjects like Integrated Math I. These tests help schools, teachers, and families see how students perform at different times of the year—in the fall, winter, and spring—and how much progress they make.
Unlike the general MAP Growth tests that compare students within the same grade, these course-specific tests compare everyone who took the Integrated Math I test. This means the norms are “user norms” rather than nationally representative. They are based on the scores of all students who took the test during the 2019–2020, 2020–2021, and 2021–2022 school years.
The chart below shows the 2022 course-specific norms for Integrated Math I. It provides clear context to help you understand how your child’s performance compares with that of other students who took the same test.
NWEA MAP Test – Frequently Asked Questions (FAQ)
What is the NWEA MAP Test?
The NWEA MAP (Measures of Academic Progress) Test is a computer-adaptive assessment used to measure a student’s academic progress and growth in subjects such as reading, math, and language usage. Schools use it to track how students are growing academically over time and to identify strengths and areas needing improvement. It adapts in real time to each student’s performance, giving more accurate data than fixed tests.
Why is the MAP Test important?
The MAP test is important because it helps teachers understand each student’s individual learning level, regardless of their grade. It provides actionable data so teachers can tailor instruction and provide the right level of challenge or support. It’s also used to measure academic growth from fall to winter to spring and across multiple years.
How is the MAP Test different from traditional tests?
Unlike traditional tests, the MAP test is adaptive. As a student answers questions correctly, the test becomes more challenging. If a student answers incorrectly, the test adjusts by offering easier questions. This provides a more precise measure of what a student knows and is ready to learn next.
What subjects are covered in the MAP Test?
The most common MAP tests are in Math, Reading, Language Usage, and Science (optional). Many schools administer MAP Growth Math and MAP Growth Reading to measure progress in these core academic areas.
What is a RIT score?
A RIT (Rasch Unit) score is the result a student receives after taking the MAP test. It is a stable, equal-interval scale that measures student performance and growth over time. RIT scores typically range from about 100 to 350. The scale is not tied to grade level but to instructional level.
What is considered a good MAP score?
A “good” MAP score depends on the student’s grade level. In general, a good score is one that shows growth over time. However, scoring above the 60th percentile compared to national norms is often considered above average. High-achieving students may score above the 80th or 90th percentile.
What is a normal MAP score?
A normal MAP score varies by grade level. For example, in 5th grade, an average MAP Reading score might be around 210-215. In Math, it could be around 215-220. NWEA provides detailed percentile charts so educators can compare students’ scores to national norms.
What is the highest MAP score ever recorded?
While there is no officially published “highest score ever,” the upper limit for MAP Growth tests is around 350 RIT points. Very few students ever reach above 330. Scores above 300 are extremely rare and usually only seen in gifted students in higher grade levels.
How often do students take the MAP test?
Most schools administer the MAP test three times per year: fall, winter, and spring. Some may test only in the fall and spring. Frequent testing helps track progress throughout the academic year.
Can parents view MAP test scores?
Yes. Most schools provide a Family Report or Student Progress Report that includes a child’s MAP scores. These reports include charts, percentile ranks, and growth projections to help parents understand how their child is progressing.
What does the percentile rank mean on the MAP test?
The percentile rank shows how a student’s score compares to other students nationwide in the same grade who took the MAP test during the same term. For example, a percentile of 75 means the student scored better than 75% of other students.
What is the Lexile range on the MAP Reading test?
When a student takes a MAP Reading test, the report often includes a Lexile range. This range helps identify books and reading materials that are appropriate for the student’s reading level. Teachers and parents can use this to guide reading selections.
Is the MAP test timed?
No, the MAP test is not timed. Students can take as long as they need to finish each section, although the average time is about 45-60 minutes per subject. The flexible timing helps reduce test anxiety and allows students to work at their own pace.
Do MAP scores affect a student’s grade?
No, MAP test scores do not directly affect a student’s report card grades. They are used to guide instruction, identify academic needs, and measure growth. Some schools may use them as part of placement decisions for gifted programs or intervention services.
What happens if my child has a low MAP score?
If your child scores lower than expected, it may indicate they need additional support in certain subject areas. Teachers use MAP data to provide targeted instruction, extra practice, or small group support. A single low score is not a cause for alarm—growth over time is what matters most.
Can students prepare for the MAP test?
While the MAP test is not a high-stakes test and does not require cramming, students can benefit from practicing academic skills in math, reading, and language usage. Practicing using grade-level materials, understanding test formats, and reading regularly can help students perform more confidently.
How do teachers use MAP scores?
Teachers use MAP scores to identify student strengths and weaknesses, group students for instruction, monitor academic growth, and set learning goals. The data also helps with curriculum planning and parent-teacher conferences.
Are MAP tests the same across all schools?
Yes and no. All schools using MAP Growth use the same test structure and scoring system, but the exact content may vary based on the grade level and test configuration chosen by the school. Some districts may also customize the test window and frequency.
What does “RIT growth” mean?
RIT growth measures how much a student’s score has changed between two testing periods. For example, if a student scores 210 in fall and 220 in spring, they had a 10-point RIT growth. This number helps teachers and parents track academic development over time.
What are goal performance levels?
Goal performance levels are score ranges for each skill area, shown as descriptors like Low, Low Average, Average, High Average, and High. These levels show how the student performed in specific instructional areas such as vocabulary or algebra concepts.
Where can I find updated MAP percentile charts and scores by grade level?
Updated MAP percentile charts and grade-level score breakdowns can be found on websites like SchoolTest.org. They provide current MAP score charts for Reading and Math across all grade levels, including 2024–2025 data.
Thank you for visiting! If you need more help on how to interpret the NWEA Map Test Student Profile and Progress Reports, then please visit our NWEA Map Scores by Grade Level 2024-2025 Guide.
We also cover iReady Diagnostic Scores by Grade Math, iReady Diagnostic Scores 2024-2025 Charts (Reading), and SAT Scores.